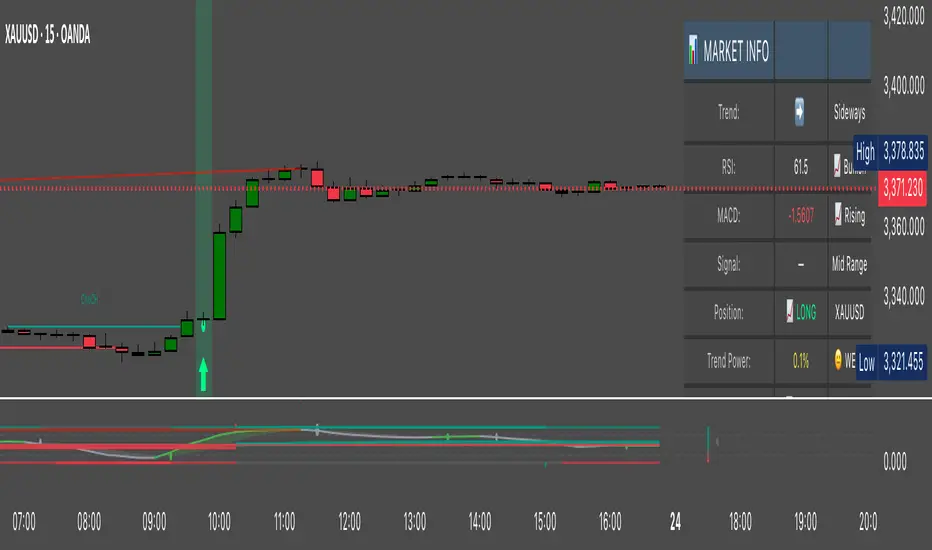
Hassi XAUUSD 15TF BUY/SELL (Anchored, Non-Repainting)What this does
Hassi XAUUSD 15TF BUY/SELL is a non-repainting signal indicator designed for XAUUSD (Gold) on the 15-minute timeframe (also works on BTCUSD). It blends EMA crossover + RSI + MACD with optional volume & volatility filters, and prints anchored BUY/SELL arrows that stay glued to their candle (no visual drifting on zoom/scale/replay). Optional confidence% labels help you judge signal quality at a glance.
Why it’s stable (no repaint)
Signals confirm only on bar close (barstate.isconfirmed).
Arrows/X marks are placed with label.new(x=bar_index, y=high/low, xloc.bar_index, yloc.abovebar/belowbar) so they remain exactly above/below the triggering candle.
No request.security for higher-TF lookaheads; no negative offsets.
How signals are generated
Core trigger: EMA(9) crosses EMA(21)
RSI filter (opt): RSI ≥ RSI Buy Min (default 50) for buys; ≤ RSI Sell Max (default 50) for sells
MACD filter (opt): MACD line crosses its signal or histogram sign matches direction
Volume/ATR filters (opt): require a basic volume spike and above-average ATR volatility (toggleable)
Divergence (opt): lightweight RSI divergence hints (diamond marks)
Anchored markers
BUY: triangle below the signal candle
SELL: triangle above the signal candle
EXIT (❌): small x above (long exit) / below (short exit) when the opposite signal confirms
Nudges: fine-tune vertical placement with tick offsets (inputs) without breaking anchoring
Inputs (defaults)
Fast EMA: 9
Slow EMA: 21
RSI Length: 14
MACD Fast/Slow/Signal: 12 / 26 / 9
Require RSI filter (50 line): ✅
Require MACD cross filter: ✅
RSI Buy Min / RSI Sell Max: 50 / 50
Buy/Sell/Exit Offset (ticks): 0 / 0 / 0
Advanced toggles: Trend Strength ✅, Dynamic Sizing (visual) ✅, Volume Filter ⛔, Volatility Filter ⛔, RSI Divergence ⛔, Show Confidence ✅
Status line/table: ✅
Alerts
Add any of these in Add Alert → Condition: this indicator
Buy Signal → {{ticker}} BUY @ {{close}} - ANCHORED SIGNAL
Sell Signal → {{ticker}} SELL @ {{close}} - ANCHORED SIGNAL
Exit Mark → {{ticker}} EXIT @ {{close}} - ANCHORED EXIT
Recommended use (15-minute XAUUSD)
Use during active sessions (London/NY overlaps).
Keep defaults; enable Volume & Volatility filters in high-noise conditions.
Add confluence (S/R, structure/BOS, session highs/lows, FVG or HTF bias).
Manage risk with structure-based SL or ATR x 1.0–1.5, and partial TP at 1:1–1.5R.
Note: You mentioned it has ~80% win rate on 15TF in your testing. Performance varies by broker feed, session, spread, and risk management. Treat results as educational, not a guarantee.
Non-repainting notes
Signals lock on close; historical arrows are final.
Labels are bar/price anchored (no drift when you zoom or change scale).
Arrays trim old labels automatically to avoid drawing limits.
FAQ
Q: Why don’t past arrows move when I resize the chart?
A: They’re label.new() anchored to bar_index and bar high/low with xloc/yloc, so they stay with the candle.
Q: Can I turn it into a strategy/backtest?
A: Yes—wrap the same signals into strategy.entry/exit, but this release is an indicator by design.
Q: Will it work on BTC or other pairs/timeframes?
A: Yes, but it’s tuned for XAUUSD M15. Adapt filters for other markets.
Changelog
v1.0 — Initial public release: anchored non-repainting arrows, optional RSI/MACD filters, volume/ATR filter, divergence hints, confidence labels, status panel, alerts.
Disclaimer
This tool is for education and analysis only. It is not financial advice. Trading involves risk; do your own research and manage risk responsibly.
Search in scripts for "RSI MACD"
Reversal Radars — Berk v2.0 (Bottom & Top)1) Combined script (Dip+Tepe)
Title:
Reversal Radars — Berk v2.0 (Bottom & Top)
Description (EN):
What it does
Two high-probability reversal detectors in one indicator: a Bottom Reversal Radar (long bias) and a Top Reversal Radar (short/hedge bias). Each radar aggregates multiple conditions into a single score and triggers when Score ≥ Threshold.
How it works
RSI regime shift: Bottom = recovery after oversold (touched 30, crosses up 35). Top = roll-over from overbought (touched 70, crosses down 65).
MACD cross: Bull (up) for bottoms, Bear (down) for tops.
EMA8 filter: Close above (bottom) / below (top) EMA(8).
Structure break (BOS): Close above recent swing high / below recent swing low (lookbackBars, using precomputed highest/lowest to avoid inconsistencies).
EMA200 proximity: Price within a configurable band (default −5% … +2%).
Volume expansion: Volume ≥ SMA(20) × multiplier (default 1.5×).
Divergence: Pivot-confirmed (3/3) bullish (bottom) or bearish (top) RSI divergence.
Scoring: RSI shift +2, divergence +2, MACD +1, EMA8 +1, BOS +1, Volume +1, EMA200 band +1.
Signals & Alerts
Bottom: label “DÖNÜŞ↑” and alert “Dipten Dönüş — Ana Sinyal” when scoreLong ≥ thrLong.
Top: label “DÖNÜŞ↓” and alert “Tepeden Dönüş — Ana Sinyal” when scoreShort ≥ thrShort.
Use Once per bar close for stable alerts.
Inputs
lenRSI, rsiOS=30, rsiRecover=35, rsiOB=70, rsiFall=65, volLen=20, volMult=1.5, lookbackBars=5, ema200 band (−5…+2%), thrLong/thrShort, toggles for Bottom/Top.
Timeframes & tips
Best on Daily/4H. Tighten thresholds (e.g., 4) and raise volume multiplier (1.8–2.0×) on lower TFs or thin liquidity.
No-repaint note
Evaluated on bar close; pivot divergences confirm with a natural ~3-bar delay.
Disclaimer
Educational use only. Not financial advice.
Tags: reversal, divergence, rsi, macd, ema, volume, trend, screener, stocks, crypto, bist
2) Bottom-only (Dip)
Title:
Bottom Reversal Radar — Berk v1.4
Description (EN):
Purpose
Scores bottoming conditions and triggers when Score ≥ Threshold (default 3).
Components
RSI recovery after oversold (30→35), MACD bull cross, close above EMA8, BOS above recent swing high, near-EMA200 band (−5…+2%), volume ≥ SMA(20)×1.5, and pivot-confirmed (3/3) bullish RSI divergence. Weights: RSI +2, Divergence +2, others +1.
Usage
Add to chart, set alert “Dipten Dönüş — Ana Sinyal”, Once per bar close. Works on any timeframe (need ≥200 bars for EMA200). Daily/4H recommended.
No-repaint
Bar-close evaluation; divergence confirms with ~3 bars.
Tags: bottom, reversal, rsi, macd, ema, volume, divergence
3) Top-only (Tepe)
Title:
Top Reversal Radar — Berk v1.0
Description (EN):
Purpose
Detects topping risk and triggers when Score ≥ Threshold (default 3) for exits/hedges.
Components
RSI roll-over from overbought (70→65), MACD bear cross, close below EMA8, BOS below recent swing low, near-EMA200 band, volume ≥ SMA(20)×1.5, and pivot-confirmed (3/3) bearish RSI divergence. Weights: RSI +2, Divergence +2, others +1.
Usage
Add to chart, set alert “Tepeden Dönüş — Ana Sinyal”, Once per bar close. Daily/4H preferred; tighten thresholds on lower TFs.
No-repaint
Bar-close evaluation; divergence confirms with ~3 bars.
Tags: top, reversal, rsi, macd, ema, volume, divergence

Market Zone Analyzer[BullByte]Understanding the Market Zone Analyzer
---
1. Purpose of the Indicator
The Market Zone Analyzer is a Pine Script™ (version 6) indicator designed to streamline market analysis on TradingView. Rather than scanning multiple separate tools, it unifies four core dimensions—trend strength, momentum, price action, and market activity—into a single, consolidated view. By doing so, it helps traders:
• Save time by avoiding manual cross-referencing of disparate signals.
• Reduce decision-making errors that can arise from juggling multiple indicators.
• Gain a clear, reliable read on whether the market is in a bullish, bearish, or sideways phase, so they can more confidently decide to enter, exit, or hold a position.
---
2. Why a Trader Should Use It
• Unified View: Combines all essential market dimensions into one easy-to-read score and dashboard, eliminating the need to piece together signals manually.
• Adaptability: Automatically adjusts its internal weighting for trend, momentum, and price action based on current volatility. Whether markets are choppy or calm, the indicator remains relevant.
• Ease of Interpretation: Outputs a simple “BULLISH,” “BEARISH,” or “SIDEWAYS” label, supplemented by an intuitive on-chart dashboard and an oscillator plot that visually highlights market direction.
• Reliability Features: Built-in smoothing of the net score and hysteresis logic (requiring consecutive confirmations before flips) minimize false signals during noisy or range-bound phases.
---
3. Why These Specific Indicators?
This script relies on a curated set of well-established technical tools, each chosen for its particular strength in measuring one of the four core dimensions:
1. Trend Strength:
• ADX/DMI (Average Directional Index / Directional Movement Index): Measures how strong a trend is, and whether the +DI line is above the –DI line (bullish) or vice versa (bearish).
• Moving Average Slope (Fast MA vs. Slow MA): Compares a shorter-period SMA to a longer-period SMA; if the fast MA sits above the slow MA, it confirms an uptrend, and vice versa for a downtrend.
• Ichimoku Cloud Differential (Senkou A vs. Senkou B): Provides a forward-looking view of trend direction; Senkou A above Senkou B signals bullishness, and the opposite signals bearishness.
2. Momentum:
• Relative Strength Index (RSI): Identifies overbought (above its dynamically calculated upper bound) or oversold (below its lower bound) conditions; changes in RSI often precede price reversals.
• Stochastic %K: Highlights shifts in short-term momentum by comparing closing price to the recent high/low range; values above its upper band signal bullish momentum, below its lower band signal bearish momentum.
• MACD Histogram: Measures the difference between the MACD line and its signal line; a positive histogram indicates upward momentum, a negative histogram indicates downward momentum.
3. Price Action:
• Highest High / Lowest Low (HH/LL) Range: Over a defined lookback period, this captures breakout or breakdown levels. A closing price near the recent highs (with a positive MA slope) yields a bullish score, and near the lows (with a negative MA slope) yields a bearish score.
• Heikin-Ashi Doji Detection: Uses Heikin-Ashi candles to identify indecision or continuation patterns. A small Heikin-Ashi body (doji) relative to recent volatility is scored as neutral; a larger body in the direction of the MA slope is scored bullish or bearish.
• Candle Range Measurement: Compares each candle’s high-low range against its own dynamic band (average range ± standard deviation). Large candles aligning with the prevailing trend score bullish or bearish accordingly; unusually small candles can indicate exhaustion or consolidation.
4. Market Activity:
• Bollinger Bands Width (BBW): Measures the distance between BB upper and lower bands; wide bands indicate high volatility, narrow bands indicate low volatility.
• Average True Range (ATR): Quantifies average price movement (volatility). A sudden spike in ATR suggests a volatile environment, while a contraction suggests calm.
• Keltner Channels Width (KCW): Similar to BBW but uses ATR around an EMA. Provides a second layer of volatility context, confirming or contrasting BBW readings.
• Volume (with Moving Average): Compares current volume to its moving average ± standard deviation. High volume validates strong moves; low volume signals potential lack of conviction.
By combining these tools, the indicator captures trend direction, momentum strength, price-action nuances, and overall market energy, yielding a more balanced and comprehensive assessment than any single tool alone.
---
4. What Makes This Indicator Stand Out
• Multi-Dimensional Analysis: Rather than relying on a lone oscillator or moving average crossover, it simultaneously evaluates trend, momentum, price action, and activity.
• Dynamic Weighting: The relative importance of trend, momentum, and price action adjusts automatically based on real-time volatility (Market Activity State). For example, in highly volatile conditions, trend and momentum signals carry more weight; in calm markets, price action signals are prioritized.
• Stability Mechanisms:
• Smoothing: The net score is passed through a short moving average, filtering out noise, especially on lower timeframes.
• Hysteresis: Both Market Activity State and the final bullish/bearish/sideways zone require two consecutive confirmations before flipping, reducing whipsaw.
• Visual Interpretation: A fully customizable on-chart dashboard displays each sub-indicator’s value, regime, score, and comment, all color-coded. The oscillator plot changes color to reflect the current market zone (green for bullish, red for bearish, gray for sideways) and shows horizontal threshold lines at +2, 0, and –2.
---
5. Recommended Timeframes
• Short-Term (5 min, 15 min): Day traders and scalpers can benefit from rapid signals, but should enable smoothing (and possibly disable hysteresis) to reduce false whipsaws.
• Medium-Term (1 h, 4 h): Swing traders find a balance between responsiveness and reliability. Less smoothing is required here, and the default parameters (e.g., ADX length = 14, RSI length = 14) perform well.
• Long-Term (Daily, Weekly): Position traders tracking major trends can disable smoothing for immediate raw readings, since higher-timeframe noise is minimal. Adjust lookback lengths (e.g., increase adxLength, rsiLength) if desired for slower signals.
Tip: If you keep smoothing off, stick to timeframes of 1 h or higher to avoid excessive signal “chatter.”
---
6. How Scoring Works
A. Individual Indicator Scores
Each sub-indicator is assigned one of three discrete scores:
• +1 if it indicates a bullish condition (e.g., RSI above its dynamically calculated upper bound).
• 0 if it is neutral (e.g., RSI between upper and lower bounds).
• –1 if it indicates a bearish condition (e.g., RSI below its dynamically calculated lower bound).
Examples of individual score assignments:
• ADX/DMI:
• +1 if ADX ≥ adxThreshold and +DI > –DI (strong bullish trend)
• –1 if ADX ≥ adxThreshold and –DI > +DI (strong bearish trend)
• 0 if ADX < adxThreshold (trend strength below threshold)
• RSI:
• +1 if RSI > RSI_upperBound
• –1 if RSI < RSI_lowerBound
• 0 otherwise
• ATR (as part of Market Activity):
• +1 if ATR > (ATR_MA + stdev(ATR))
• –1 if ATR < (ATR_MA – stdev(ATR))
• 0 otherwise
Each of the four main categories shares this same +1/0/–1 logic across their sub-components.
B. Category Scores
Once each sub-indicator reports +1, 0, or –1, these are summed within their categories as follows:
• Trend Score = (ADX score) + (MA slope score) + (Ichimoku differential score)
• Momentum Score = (RSI score) + (Stochastic %K score) + (MACD histogram score)
• Price Action Score = (Highest-High/Lowest-Low score) + (Heikin-Ashi doji score) + (Candle range score)
• Market Activity Raw Score = (BBW score) + (ATR score) + (KC width score) + (Volume score)
Each category’s summed value can range between –3 and +3 (for Trend, Momentum, and Price Action), and between –4 and +4 for Market Activity raw.
C. Market Activity State and Dynamic Weight Adjustments
Rather than contributing directly to the netScore like the other three categories, Market Activity determines how much weight to assign to Trend, Momentum, and Price Action:
1. Compute Market Activity Raw Score by summing BBW, ATR, KCW, and Volume individual scores (each +1/0/–1).
2. Bucket into High, Medium, or Low Activity:
• High if raw Score ≥ 2 (volatile market).
• Low if raw Score ≤ –2 (calm market).
• Medium otherwise.
3. Apply Hysteresis (if enabled): The state only flips after two consecutive bars register the same high/low/medium label.
4. Set Category Weights:
• High Activity: Trend = 50 %, Momentum = 35 %, Price Action = 15 %.
• Low Activity: Trend = 25 %, Momentum = 20 %, Price Action = 55 %.
• Medium Activity: Use the trader’s base weight inputs (e.g., Trend = 40 %, Momentum = 30 %, Price Action = 30 % by default).
D. Calculating the Net Score
5. Normalize Base Weights (so that the sum of Trend + Momentum + Price Action always equals 100 %).
6. Determine Current Weights based on the Market Activity State (High/Medium/Low).
7. Compute Each Category’s Contribution: Multiply (categoryScore) × (currentWeight).
8. Sum Contributions to get the raw netScore (a floating-point value that can exceed ±3 when scores are strong).
9. Smooth the netScore over two bars (if smoothing is enabled) to reduce noise.
10. Apply Hysteresis to the Final Zone:
• If the smoothed netScore ≥ +2, the bar is classified as “Bullish.”
• If the smoothed netScore ≤ –2, the bar is classified as “Bearish.”
• Otherwise, it is “Sideways.”
• To prevent rapid flips, the script requires two consecutive bars in the new zone before officially changing the displayed zone (if hysteresis is on).
E. Thresholds for Zone Classification
• BULLISH: netScore ≥ +2
• BEARISH: netScore ≤ –2
• SIDEWAYS: –2 < netScore < +2
---
7. Role of Volatility (Market Activity State) in Scoring
Volatility acts as a dynamic switch that shifts which category carries the most influence:
1. High Activity (Volatile):
• Detected when at least two sub-scores out of BBW, ATR, KCW, and Volume equal +1.
• The script sets Trend weight = 50 % and Momentum weight = 35 %. Price Action weight is minimized at 15 %.
• Rationale: In volatile markets, strong trending moves and momentum surges dominate, so those signals are more reliable than nuanced candle patterns.
2. Low Activity (Calm):
• Detected when at least two sub-scores out of BBW, ATR, KCW, and Volume equal –1.
• The script sets Price Action weight = 55 %, Trend = 25 %, and Momentum = 20 %.
• Rationale: In quiet, sideways markets, subtle price-action signals (breakouts, doji patterns, small-range candles) are often the best early indicators of a new move.
3. Medium Activity (Balanced):
• Raw Score between –1 and +1 from the four volatility metrics.
• Uses whatever base weights the trader has specified (e.g., Trend = 40 %, Momentum = 30 %, Price Action = 30 %).
Because volatility can fluctuate rapidly, the script employs hysteresis on Market Activity State: a new High or Low state must occur on two consecutive bars before weights actually shift. This avoids constant back-and-forth weight changes and provides more stability.
---
8. Scoring Example (Hypothetical Scenario)
• Symbol: Bitcoin on a 1-hour chart.
• Market Activity: Raw volatility sub-scores show BBW (+1), ATR (+1), KCW (0), Volume (+1) → Total raw Score = +3 → High Activity.
• Weights Selected: Trend = 50 %, Momentum = 35 %, Price Action = 15 %.
• Trend Signals:
• ADX strong and +DI > –DI → +1
• Fast MA above Slow MA → +1
• Ichimoku Senkou A > Senkou B → +1
→ Trend Score = +3
• Momentum Signals:
• RSI above upper bound → +1
• MACD histogram positive → +1
• Stochastic %K within neutral zone → 0
→ Momentum Score = +2
• Price Action Signals:
• Highest High/Lowest Low check yields 0 (close not near extremes)
• Heikin-Ashi doji reading is neutral → 0
• Candle range slightly above upper bound but trend is strong, so → +1
→ Price Action Score = +1
• Compute Net Score (before smoothing):
• Trend contribution = 3 × 0.50 = 1.50
• Momentum contribution = 2 × 0.35 = 0.70
• Price Action contribution = 1 × 0.15 = 0.15
• Raw netScore = 1.50 + 0.70 + 0.15 = 2.35
• Since 2.35 ≥ +2 and hysteresis is met, the final zone is “Bullish.”
Although the netScore lands at 2.35 (Bullish), smoothing might bring it slightly below 2.00 on the first bar (e.g., 1.90), in which case the script would wait for a second consecutive reading above +2 before officially classifying the zone as Bullish (if hysteresis is enabled).
---
9. Correlation Between Categories
The four categories—Trend Strength, Momentum, Price Action, and Market Activity—often reinforce or offset one another. The script takes advantage of these natural correlations:
• Bullish Alignment: If ADX is strong and pointed upward, fast MA is above slow MA, and Ichimoku is positive, that usually coincides with RSI climbing above its upper bound and the MACD histogram turning positive. In such cases, both Trend and Momentum categories generate +1 or +2. Because the Market Activity State is likely High (given the accompanying volatility), Trend and Momentum weights are at their peak, so the netScore quickly crosses into Bullish territory.
• Sideways/Consolidation: During a low-volatility, sideways phase, ADX may fall below its threshold, MAs may flatten, and RSI might hover in the neutral band. However, subtle price-action signals (like a small breakout candle or a Heikin-Ashi candle with a slight bias) can still produce a +1 in the Price Action category. If Market Activity is Low, Price Action’s weight (55 %) can carry enough influence—even if Trend and Momentum are neutral—to push the netScore out of “Sideways” into a mild bullish or bearish bias.
• Opposing Signals: When Trend is bullish but Momentum turns negative (for example, price continues up but RSI rolls over), the two scores can partially cancel. Market Activity may remain Medium, in which case the netScore lingers near zero (Sideways). The trader can then wait for either a clearer momentum shift or a fresh price-action breakout before committing.
By dynamically recognizing these correlations and adjusting weights, the indicator ensures that:
• When Trend and Momentum align (and volatility supports it), the netScore leaps strongly into Bullish or Bearish.
• When Trend is neutral but Price Action shows an early move in a low-volatility environment, Price Action’s extra weight in the Low Activity State can still produce actionable signals.
---
10. Market Activity State & Its Role (Detailed)
The Market Activity State is not a direct category score—it is an overarching context setter for how heavily to trust Trend, Momentum, or Price Action. Here’s how it is derived and applied:
1. Calculate Four Volatility Sub-Scores:
• BBW: Compare the current band width to its own moving average ± standard deviation. If BBW > (BBW_MA + stdev), assign +1 (high volatility); if BBW < (BBW_MA × 0.5), assign –1 (low volatility); else 0.
• ATR: Compare ATR to its moving average ± standard deviation. A spike above the upper threshold is +1; a contraction below the lower threshold is –1; otherwise 0.
• KCW: Same logic as ATR but around the KCW mean.
• Volume: Compare current volume to its volume MA ± standard deviation. Above the upper threshold is +1; below the lower threshold is –1; else 0.
2. Sum Sub-Scores → Raw Market Activity Score: Range between –4 and +4.
3. Assign Market Activity State:
• High Activity: Raw Score ≥ +2 (at least two volatility metrics are strongly spiking).
• Low Activity: Raw Score ≤ –2 (at least two metrics signal unusually low volatility or thin volume).
• Medium Activity: Raw Score is between –1 and +1 inclusive.
4. Hysteresis for Stability:
• If hysteresis is enabled, a new state only takes hold after two consecutive bars confirm the same High, Medium, or Low label.
• This prevents the Market Activity State from bouncing around when volatility is on the fence.
5. Set Category Weights Based on Activity State:
• High Activity: Trend = 50 %, Momentum = 35 %, Price Action = 15 %.
• Low Activity: Trend = 25 %, Momentum = 20 %, Price Action = 55 %.
• Medium Activity: Use trader’s base weights (e.g., Trend = 40 %, Momentum = 30 %, Price Action = 30 %).
6. Impact on netScore: Because category scores (–3 to +3) multiply by these weights, High Activity amplifies the effect of strong Trend and Momentum scores; Low Activity amplifies the effect of Price Action.
7. Market Context Tooltip: The dashboard includes a tooltip summarizing the current state—e.g., “High activity, trend and momentum prioritized,” “Low activity, price action prioritized,” or “Balanced market, all categories considered.”
---
11. Category Weights: Base vs. Dynamic
Traders begin by specifying base weights for Trend Strength, Momentum, and Price Action that sum to 100 %. These apply only when volatility is in the Medium band. Once volatility shifts:
• High Volatility Overrides:
• Trend jumps from its base (e.g., 40 %) to 50 %.
• Momentum jumps from its base (e.g., 30 %) to 35 %.
• Price Action is reduced to 15 %.
Example: If base weights were Trend = 40 %, Momentum = 30 %, Price Action = 30 %, then in High Activity they become 50/35/15. A Trend score of +3 now contributes 3 × 0.50 = +1.50 to netScore; a Momentum +2 contributes 2 × 0.35 = +0.70. In total, Trend + Momentum can easily push netScore above the +2 threshold on its own.
• Low Volatility Overrides:
• Price Action leaps from its base (30 %) to 55 %.
• Trend falls to 25 %, Momentum falls to 20 %.
Why? When markets are quiet, subtle candle breakouts, doji patterns, and small-range expansions tend to foreshadow the next swing more effectively than raw trend readings. A Price Action score of +3 in this state contributes 3 × 0.55 = +1.65, which can carry the netScore toward +2—even if Trend and Momentum are neutral or only mildly positive.
Because these weight shifts happen only after two consecutive bars confirm a High or Low state (if hysteresis is on), the indicator avoids constantly flipping its emphasis during borderline volatility phases.
---
12. Dominant Category Explained
Within the dashboard, a label such as “Trend Dominant,” “Momentum Dominant,” or “Price Action Dominant” appears when one category’s absolute weighted contribution to netScore is the largest. Concretely:
• Compute each category’s weighted contribution = (raw category score) × (current weight).
• Compare the absolute values of those three contributions.
• The category with the highest absolute value is flagged as Dominant for that bar.
Why It Matters:
• Momentum Dominant: Indicates that the combined force of RSI, Stochastic, and MACD (after weighting) is pushing netScore farther than either Trend or Price Action. In practice, it means that short-term sentiment and speed of change are the primary drivers right now, so traders should watch for continued momentum signals before committing to a trade.
• Trend Dominant: Means ADX, MA slope, and Ichimoku (once weighted) outweigh the other categories. This suggests a strong directional move is in place; trend-following entries or confirming pullbacks are likely to succeed.
• Price Action Dominant: Occurs when breakout/breakdown patterns, Heikin-Ashi candle readings, and range expansions (after weighting) are the most influential. This often happens in calmer markets, where subtle shifts in candle structure can foreshadow bigger moves.
By explicitly calling out which category is carrying the most weight at any moment, the dashboard gives traders immediate insight into why the netScore is tilting toward bullish, bearish, or sideways.
---
13. Oscillator Plot: How to Read It
The “Net Score” oscillator sits below the dashboard and visually displays the smoothed netScore as a line graph. Key features:
1. Value Range: In normal conditions it oscillates roughly between –3 and +3, but extreme confluences can push it outside that range.
2. Horizontal Threshold Lines:
• +2 Line (Bullish threshold)
• 0 Line (Neutral midline)
• –2 Line (Bearish threshold)
3. Zone Coloring:
• Green Background (Bullish Zone): When netScore ≥ +2.
• Red Background (Bearish Zone): When netScore ≤ –2.
• Gray Background (Sideways Zone): When –2 < netScore < +2.
4. Dynamic Line Color:
• The plotted netScore line itself is colored green in a Bullish Zone, red in a Bearish Zone, or gray in a Sideways Zone, creating an immediate visual cue.
Interpretation Tips:
• Crossing Above +2: Signals a strong enough combined trend/momentum/price-action reading to classify as Bullish. Many traders wait for a clear crossing plus a confirmation candle before entering a long position.
• Crossing Below –2: Indicates a strong Bearish signal. Traders may consider short or exit strategies.
• Rising Slope, Even Below +2: If netScore climbs steadily from neutral toward +2, it demonstrates building bullish momentum.
• Divergence: If price makes a higher high but the oscillator fails to reach a new high, it can warn of weakening momentum and a potential reversal.
---
14. Comments and Their Necessity
Every sub-indicator (ADX, MA slope, Ichimoku, RSI, Stochastic, MACD, HH/LL, Heikin-Ashi, Candle Range, BBW, ATR, KCW, Volume) generates a short comment that appears in the detailed dashboard. Examples:
• “Strong bullish trend” or “Strong bearish trend” for ADX/DMI
• “Fast MA above slow MA” or “Fast MA below slow MA” for MA slope
• “RSI above dynamic threshold” or “RSI below dynamic threshold” for RSI
• “MACD histogram positive” or “MACD histogram negative” for MACD Hist
• “Price near highs” or “Price near lows” for HH/LL checks
• “Bullish Heikin Ashi” or “Bearish Heikin Ashi” for HA Doji scoring
• “Large range, trend confirmed” or “Small range, trend contradicted” for Candle Range
Additionally, the top-row comment for each category is:
• Trend: “Highly Bullish,” “Highly Bearish,” or “Neutral Trend.”
• Momentum: “Strong Momentum,” “Weak Momentum,” or “Neutral Momentum.”
• Price Action: “Bullish Action,” “Bearish Action,” or “Neutral Action.”
• Market Activity: “Volatile Market,” “Calm Market,” or “Stable Market.”
Reasons for These Comments:
• Transparency: Shows exactly how each sub-indicator contributed to its category score.
• Education: Helps traders learn why a category is labeled bullish, bearish, or neutral, building intuition over time.
• Customization: If, for example, the RSI comment says “RSI neutral” despite an impending trend shift, a trader might choose to adjust RSI length or thresholds.
In the detailed dashboard, hovering over each comment cell also reveals a tooltip with additional context (e.g., “Fast MA above slow MA” or “Senkou A above Senkou B”), helping traders understand the precise rule behind that +1, 0, or –1 assignment.
---
15. Real-Life Example (Consolidated)
• Instrument & Timeframe: Bitcoin (BTCUSD), 1-hour chart.
• Current Market Activity: BBW and ATR both spike (+1 each), KCW is moderately high (+1), but volume is only neutral (0) → Raw Market Activity Score = +2 → State = High Activity (after two bars, if hysteresis is on).
• Category Weights Applied: Trend = 50 %, Momentum = 35 %, Price Action = 15 %.
• Trend Sub-Scores:
1. ADX = 25 (above threshold 20) with +DI > –DI → +1.
2. Fast MA (20-period) sits above Slow MA (50-period) → +1.
3. Ichimoku: Senkou A > Senkou B → +1.
→ Trend Score = +3.
• Momentum Sub-Scores:
4. RSI = 75 (above its moving average +1 stdev) → +1.
5. MACD histogram = +0.15 → +1.
6. Stochastic %K = 50 (mid-range) → 0.
→ Momentum Score = +2.
• Price Action Sub-Scores:
7. Price is not within 1 % of the 20-period high/low and slope = positive → 0.
8. Heikin-Ashi body is slightly larger than stdev over last 5 bars with haClose > haOpen → +1.
9. Candle range is just above its dynamic upper bound but trend is already captured, so → +1.
→ Price Action Score = +2.
• Calculate netScore (before smoothing):
• Trend contribution = 3 × 0.50 = 1.50
• Momentum contribution = 2 × 0.35 = 0.70
• Price Action contribution = 2 × 0.15 = 0.30
• Raw netScore = 1.50 + 0.70 + 0.30 = 2.50 → Immediately classified as Bullish.
• Oscillator & Dashboard Output:
• The oscillator line crosses above +2 and turns green.
• Dashboard displays:
• Trend Regime “BULLISH,” Trend Score = 3, Comment = “Highly Bullish.”
• Momentum Regime “BULLISH,” Momentum Score = 2, Comment = “Strong Momentum.”
• Price Action Regime “BULLISH,” Price Action Score = 2, Comment = “Bullish Action.”
• Market Activity State “High,” Comment = “Volatile Market.”
• Weights: Trend 50 %, Momentum 35 %, Price Action 15 %.
• Dominant Category: Trend (because 1.50 > 0.70 > 0.30).
• Overall Score: 2.50, posCount = (three +1s in Trend) + (two +1s in Momentum) + (two +1s in Price Action) = 7 bullish signals, negCount = 0.
• Final Zone = “BULLISH.”
• The trader sees that both Trend and Momentum are reinforcing each other under high volatility. They might wait one more candle for confirmation but already have strong evidence to consider a long.
---
• .
---
Disclaimer
This indicator is strictly a technical analysis tool and does not constitute financial advice. All trading involves risk, including potential loss of capital. Past performance is not indicative of future results. Traders should:
• Always backtest the “Market Zone Analyzer ” on their chosen symbols and timeframes before committing real capital.
• Combine this tool with sound risk management, position sizing, and, if possible, fundamental analysis.
• Understand that no indicator is foolproof; always be prepared for unexpected market moves.
Goodluck
-BullByte!
---

Multi-Fibonacci Trend Average[FibonacciFlux]Multi-Fibonacci Trend Average (MFTA): An Institutional-Grade Trend Confluence Indicator for Discerning Market Participants
My original indicator/Strategy:
Engineered for the sophisticated demands of institutional and advanced traders, the Multi-Fibonacci Trend Average (MFTA) indicator represents a paradigm shift in technical analysis. This meticulously crafted tool is designed to furnish high-definition trend signals within the complexities of modern financial markets. Anchored in the rigorous principles of Fibonacci ratios and augmented by advanced averaging methodologies, MFTA delivers a granular perspective on trend dynamics. Its integration of Multi-Timeframe (MTF) filters provides unparalleled signal robustness, empowering strategic decision-making with a heightened degree of confidence.
MFTA indicator on BTCUSDT 15min chart with 1min RSI and MACD filters enabled. Note the refined signal generation with reduced noise.
MFTA indicator on BTCUSDT 15min chart without MTF filters. While capturing more potential trading opportunities, it also generates a higher frequency of signals, including potential false positives.
Core Innovation: Proprietary Fibonacci-Enhanced Supertrend Averaging Engine
The MFTA indicator’s core innovation lies in its proprietary implementation of Supertrend analysis, strategically fortified by Fibonacci ratios to construct a truly dynamic volatility envelope. Departing from conventional Supertrend methodologies, MFTA autonomously computes not one, but three distinct Supertrend lines. Each of these lines is uniquely parameterized by a specific Fibonacci factor: 0.618 (Weak), 1.618 (Medium/Golden Ratio), and 2.618 (Strong/Extended Fibonacci).
// Fibonacci-based factors for multiple Supertrend calculations
factor1 = input.float(0.618, 'Factor 1 (Weak/Fibonacci)', minval=0.01, step=0.01, tooltip='Factor 1 (Weak/Fibonacci)', group="Fibonacci Supertrend")
factor2 = input.float(1.618, 'Factor 2 (Medium/Golden Ratio)', minval=0.01, step=0.01, tooltip='Factor 2 (Medium/Golden Ratio)', group="Fibonacci Supertrend")
factor3 = input.float(2.618, 'Factor 3 (Strong/Extended Fib)', minval=0.01, step=0.01, tooltip='Factor 3 (Strong/Extended Fib)', group="Fibonacci Supertrend")
This multi-faceted architecture adeptly captures a spectrum of market volatility sensitivities, ensuring a comprehensive assessment of prevailing conditions. Subsequently, the indicator algorithmically synthesizes these disparate Supertrend lines through arithmetic averaging. To achieve optimal signal fidelity and mitigate inherent market noise, this composite average is further refined utilizing an Exponential Moving Average (EMA).
// Calculate average of the three supertends and a smoothed version
superlength = input.int(21, 'Smoothing Length', tooltip='Smoothing Length for Average Supertrend', group="Fibonacci Supertrend")
average_trend = (supertrend1 + supertrend2 + supertrend3) / 3
smoothed_trend = ta.ema(average_trend, superlength)
The resultant ‘Smoothed Trend’ line emerges as a remarkably responsive yet stable trend demarcation, offering demonstrably superior clarity and precision compared to singular Supertrend implementations, particularly within the turbulent dynamics of high-volatility markets.
Elevated Signal Confluence: Integrated Multi-Timeframe (MTF) Validation Suite
MFTA transcends the limitations of conventional trend indicators by incorporating an advanced suite of three independent MTF filters: RSI, MACD, and Volume. These filters function as sophisticated validation protocols, rigorously ensuring that only signals exhibiting a confluence of high-probability factors are brought to the forefront.
1. Granular Lower Timeframe RSI Momentum Filter
The Relative Strength Index (RSI) filter, computed from a user-defined lower timeframe, furnishes critical momentum-based signal validation. By meticulously monitoring RSI dynamics on an accelerated timeframe, traders gain the capacity to evaluate underlying momentum strength with precision, prior to committing to signal execution on the primary chart timeframe.
// --- Lower Timeframe RSI Filter ---
ltf_rsi_filter_enable = input.bool(false, title="Enable RSI Filter", group="MTF Filters", tooltip="Use RSI from lower timeframe as a filter")
ltf_rsi_timeframe = input.timeframe("1", title="RSI Timeframe", group="MTF Filters", tooltip="Timeframe for RSI calculation")
ltf_rsi_length = input.int(14, title="RSI Length", minval=1, group="MTF Filters", tooltip="Length for RSI calculation")
ltf_rsi_threshold = input.int(30, title="RSI Threshold", minval=0, maxval=100, group="MTF Filters", tooltip="RSI value threshold for filtering signals")
2. Convergent Lower Timeframe MACD Trend-Momentum Filter
The Moving Average Convergence Divergence (MACD) filter, also calculated on a lower timeframe basis, introduces a critical layer of trend-momentum convergence confirmation. The bullish signal configuration rigorously mandates that the MACD line be definitively positioned above the Signal line on the designated lower timeframe. This stringent condition ensures a robust indication of converging momentum that aligns synergistically with the prevailing trend identified on the primary timeframe.
// --- Lower Timeframe MACD Filter ---
ltf_macd_filter_enable = input.bool(false, title="Enable MACD Filter", group="MTF Filters", tooltip="Use MACD from lower timeframe as a filter")
ltf_macd_timeframe = input.timeframe("1", title="MACD Timeframe", group="MTF Filters", tooltip="Timeframe for MACD calculation")
ltf_macd_fast_length = input.int(12, title="MACD Fast Length", minval=1, group="MTF Filters", tooltip="Fast EMA length for MACD")
ltf_macd_slow_length = input.int(26, title="MACD Slow Length", minval=1, group="MTF Filters", tooltip="Slow EMA length for MACD")
ltf_macd_signal_length = input.int(9, title="MACD Signal Length", minval=1, group="MTF Filters", tooltip="Signal SMA length for MACD")
3. Definitive Volume Confirmation Filter
The Volume Filter functions as an indispensable arbiter of trade conviction. By establishing a dynamic volume threshold, defined as a percentage relative to the average volume over a user-specified lookback period, traders can effectively ensure that all generated signals are rigorously validated by demonstrably increased trading activity. This pivotal validation step signifies robust market participation, substantially diminishing the potential for spurious or false breakout signals.
// --- Volume Filter ---
volume_filter_enable = input.bool(false, title="Enable Volume Filter", group="MTF Filters", tooltip="Use volume level as a filter")
volume_threshold_percent = input.int(title="Volume Threshold (%)", defval=150, minval=100, group="MTF Filters", tooltip="Minimum volume percentage compared to average volume to allow signal (100% = average)")
These meticulously engineered filters operate in synergistic confluence, requiring all enabled filters to definitively satisfy their pre-defined conditions before a Buy or Sell signal is generated. This stringent multi-layered validation process drastically minimizes the incidence of false positive signals, thereby significantly enhancing entry precision and overall signal reliability.
Intuitive Visual Architecture & Actionable Intelligence
MFTA provides a demonstrably intuitive and visually rich charting environment, meticulously delineating trend direction and momentum through precisely color-coded plots:
Average Supertrend: Thin line, green/red for uptrend/downtrend, immediate directional bias.
Smoothed Supertrend: Bold line, teal/purple for uptrend/downtrend, cleaner, institutionally robust trend.
Dynamic Trend Fill: Green/red fill between Supertrends quantifies trend strength and momentum.
Adaptive Background Coloring: Light green/red background mirrors Smoothed Supertrend direction, holistic trend perspective.
Precision Buy/Sell Signals: ‘BUY’/‘SELL’ labels appear on chart when trend touch and MTF filter confluence are satisfied, facilitating high-conviction trade action.
MFTA indicator applied to BTCUSDT 4-hour chart, showcasing its effectiveness on higher timeframes. The Smoothed Length parameter is increased to 200 for enhanced smoothness on this timeframe, coupled with 1min RSI and Volume filters for signal refinement. This illustrates the indicator's adaptability across different timeframes and market conditions.
Strategic Applications for Institutional Mandates
MFTA’s sophisticated design provides distinct advantages for advanced trading operations and institutional investment mandates. Key strategic applications include:
High-Probability Trend Identification: Fibonacci-averaged Supertrend with MTF filters robustly identifies high-probability trend continuations and reversals, enhancing alpha generation.
Precision Entry/Exit Signals: Volume and momentum-filtered signals enable institutional-grade precision for optimized risk-adjusted returns.
Algorithmic Trading Integration: Clear signal logic facilitates seamless integration into automated trading systems for scalable strategy deployment.
Multi-Asset/Timeframe Versatility: Adaptable parameters ensure applicability across diverse asset classes and timeframes, catering to varied trading mandates.
Enhanced Risk Management: Superior signal fidelity from MTF filters inherently reduces false signals, supporting robust risk management protocols.
Granular Customization and Parameterized Control
MFTA offers unparalleled customization, empowering users to fine-tune parameters for precise alignment with specific trading styles and market conditions. Key adjustable parameters include:
Fibonacci Factors: Adjust Supertrend sensitivity to volatility regimes.
ATR Length: Control volatility responsiveness in Supertrend calculations.
Smoothing Length: Refine Smoothed Trend line responsiveness and noise reduction.
MTF Filter Parameters: Independently configure timeframes, lookback periods, and thresholds for RSI, MACD, and Volume filters for optimal signal filtering.
Disclaimer
MFTA is meticulously engineered for high-quality trend signals; however, no indicator guarantees profit. Market conditions are unpredictable, and trading involves substantial risk. Rigorous backtesting and forward testing across diverse datasets, alongside a comprehensive understanding of the indicator's logic, are essential before live deployment. Past performance is not indicative of future results. MFTA is for informational and analytical purposes only and is not financial or investment advice.

MLB Momentum IndicatorMLB Momentum Indicator is a no‐lookahead technical indicator designed to signal intraday trend shifts and potential reversal points. It combines several well‐known technical components—Moving Averages, MACD, RSI, and optional ADX & Volume filters—to deliver high‐probability buy/sell signals on your chart.
Below is an overview of how it works and what each part does:
1. Moving Average Trend Filter
The script uses two moving averages (fast and slow) to determine the primary trend:
isUpTrend if Fast MA > Slow MA
isDownTrend if Fast MA < Slow MA
You can select the MA method—SMA, EMA, or WMA—and customize lengths.
Why it matters: The indicator only gives bullish signals if the trend is up, and bearish signals if the trend is down, helping avoid trades that go against the bigger flow.
2. MACD Confirmation (Momentum)
Uses MACD (with user‐defined Fast, Slow, and Signal lengths) to check momentum:
macdBuySignal if the MACD line crosses above its signal line (bullish)
macdSellSignal if the MACD line crosses below its signal line (bearish)
Why it matters: MACD crossovers confirm an emerging momentum shift, aligning signals with actual price acceleration rather than random fluctuation.
3. RSI Overbought/Oversold Filter
RSI (Relative Strength Index) is calculated with a chosen length, plus Overbought & Oversold thresholds:
For long signals: the RSI must be below the Overbought threshold (e.g. 70).
For short signals: the RSI must be above the Oversold threshold (e.g. 30).
Why it matters: Prevents buying when price is already overbought or shorting when price is too oversold, filtering out possible poor‐risk trades.
4. Optional ADX Filter (Trend Strength)
If enabled, ADX must exceed a chosen threshold (e.g., 20) for a signal to be valid:
This ensures you’re only taking trades in markets that have sufficient directional momentum.
Why it matters: It weeds out choppy, sideways conditions where signals are unreliable.
5. Optional Volume Filter (High‐Participation Moves)
If enabled, the indicator checks whether current volume is above a certain multiple of its moving average (e.g., 1.5× average volume).
Why it matters: High volume often indicates stronger institutional interest, validating potential breakouts or reversals.
6. ATR & Chandelier (Visual Reference)
For reference only, the script can display ATR‐based stop levels or a Chandelier Exit line:
ATR (Average True Range) helps gauge volatility and can inform stop‐loss distances.
Chandelier Exit is a trailing stop technique that adjusts automatically as price moves.
Why it matters: Though this version of the script doesn’t execute trades, these lines help you see how far to place stops or how to ride a trend.
7. Final Bullish / Bearish Signal
When all conditions (trend, MACD, RSI, optional ADX, optional Volume) line up for a long, a green “Long” arrow appears.
When all conditions line up for a short, a red “Short” arrow appears.
Why it matters: You get a clear, on‐chart signal for each potential entry, rather than needing to check multiple indicators manually.
8. Session & Date Filtering
The script allows choosing a start/end date and an optional session window (e.g. 09:30–16:00).
Why it matters: Helps limit signals to a specific historical backtest range or trading hours, which can be crucial for day traders (e.g., stock market hours only).
Putting It All Together
Primary Trend → ensures you trade in line with the bigger direction.
MACD & RSI → confirm momentum and avoid overbought/oversold extremes.
ADX & Volume → optional filters for strong trend strength & genuine interest.
Arrows → each potential buy (Long) or sell (Short) signal is clearly shown on your chart.
Use Cases
5‐Minute Scalping: Shorter RSI/MACD lengths to catch small, frequent intraday moves.
Swing Trading: Larger MAs, bigger RSI thresholds, and using ADX to filter only major trends.
Cautious Approach: Enable volume & ADX filters to reduce false signals in choppy markets.
Benefits & Limitations
Benefits:
Consolidates multiple indicators into one overlay.
Clear buy/sell signals with optional dynamic volatility references.
Flexible user inputs adapt to different trading styles/timeframes.
Limitations:
Like all technical indicators, it can produce false signals in sideways or news‐driven markets.
Success depends heavily on user settings and the particular market’s behavior.
Summary
The MLB Momentum Indicator combines a trend filter (MAs), momentum check (MACD), overbought/oversold gating (RSI), and optional ADX/Volume filters to create clear buy/sell arrows on your chart. This approach encourages trading in sync with both trend and momentum, and helps avoid suboptimal entries when volume or trend strength is lacking. It can be tailored to scalp micro‐moves on lower timeframes or used for higher‐timeframe swing trading by adjusting the input settings.

SufinBDThis TradingView script combines RSI, Stochastic RSI, MACD, and Bollinger Bands to generate Buy and Sell signals on two different timeframes: 4-hour (4H) and Daily (1D). The strategy aims to provide entry and exit points based on a multi-indicator confirmation approach, helping traders make more informed decisions.
Features:
RSI (Relative Strength Index):
Measures the speed and change of price movements.
The script looks for oversold conditions (RSI below 30) for buy signals and overbought conditions (RSI above 70) for sell signals.
Stochastic RSI:
Measures the level of RSI relative to its high-low range over a given period.
A Stochastic RSI below 0.2 indicates oversold conditions, and a value above 0.8 indicates overbought conditions.
It helps identify overbought and oversold conditions in a more precise manner than regular RSI.
MACD (Moving Average Convergence Divergence):
A trend-following momentum indicator that shows the relationship between two moving averages of a security's price.
The MACD line crossing above the Signal line generates bullish signals, and vice versa for bearish signals.
Bollinger Bands:
A volatility indicator that consists of a middle band (SMA of price), an upper band, and a lower band.
When the price is below the lower band, it signals potential buy opportunities, while prices above the upper band signal potential sell opportunities.
Timeframe Usage:
The script calculates indicators for both the 4-hour (4H) and Daily (1D) timeframes.
The combined signals from these two timeframes are used to generate Buy and Sell alerts.
Buy Signal:
A Buy signal is generated when all of the following conditions are met:
RSI on both 4H and 1D is below 30 (oversold conditions).
Stochastic RSI on both timeframes is below 0.2.
The MACD line is above the Signal line on both timeframes.
The price is below the lower Bollinger Band on both the 4H and 1D charts.
Sell Signal:
A Sell signal is generated when all of the following conditions are met:
RSI on both 4H and 1D is above 70 (overbought conditions).
Stochastic RSI on both timeframes is above 0.8.
The MACD line is below the Signal line on both timeframes.
The price is above the upper Bollinger Band on both the 4H and 1D charts.
Visuals:
Buy signals are marked with green labels below the bars.
Sell signals are marked with red labels above the bars.
Bollinger Bands are displayed on the chart with the upper and lower bands marked in blue (for 4H) and orange (for 1D).
Purpose:
This script aims to provide more reliable buy/sell signals by combining indicators across multiple timeframes. It is ideal for traders who want to use multiple confirmation points before entering or exiting a trade.
How to Use:
Apply the script to any chart on TradingView.
Look for Buy and Sell signals that meet the conditions above.
You can adjust the timeframe (e.g., 4H or 1D) based on your trading strategy.
This script can be used for intraday trading, swing trading, or position trading depending on your preferred timeframes.
Example of Signal Interpretation:
Buy Signal:
If all conditions are met (e.g., RSI is under 30, Stochastic RSI is under 0.2, MACD is bullish, and price is below the lower Bollinger Band on both the 4-hour and daily charts), the script will show a green "BUY" label below the price bar.
Sell Signal:
If all conditions are met (e.g., RSI is over 70, Stochastic RSI is over 0.8, MACD is bearish, and price is above the upper Bollinger Band on both timeframes), the script will show a red "SELL" label above the price bar.
This combination of indicators offers a multi-layered confirmation approach, which aims to reduce the risk of false signals and increase the reliability of your trading decisions.

Bullish/Bearish Sentiment Cycle Indicator Sentiment Cycle Indicator: Understanding Market Psychology Through Technical Analysis
Overview:
The Sentiment Cycle Indicator is a unique blend of multiple technical analysis tools designed to help traders visualize and capitalize on market sentiment shifts. This indicator combines RSI (Relative Strength Index), MACD (Moving Average Convergence Divergence), volume analysis, and sentiment cycle detection to provide actionable buy and sell signals. By monitoring the emotional stages that market participants go through—such as optimism, excitement, euphoria, anxiety, denial, panic, and depression—this indicator helps traders identify turning points in the market cycle.
Key Components and How They Work Together:
1. RSI (Relative Strength Index):
• The RSI is a momentum oscillator that measures the speed and change of price movements. In this indicator, the RSI is used to determine overbought or oversold conditions, which are then translated into signals for potential market sentiment shifts.
• Integration: The RSI provides the foundational layer to assess whether the market is generally bullish or bearish. When combined with MACD and volume analysis, it helps confirm the strength of a sentiment cycle phase.
2. MACD (Moving Average Convergence Divergence):
• MACD is a trend-following indicator that shows the relationship between two moving averages of a security’s price. It is used in this script to identify trend direction and momentum changes.
• Integration: MACD crossovers are aligned with RSI conditions to detect the shift between bullish and bearish market sentiments. The MACD’s ability to capture trend changes strengthens the identification of sentiment phases, such as “optimism” or “panic.”
3. Volume Analysis:
• Volume analysis is a critical component in understanding market sentiment. The indicator uses a moving average of volume to detect volume spikes, which often coincide with significant market moves or reversals.
• Integration: Volume spikes are used to gauge the intensity of sentiment changes. For example, high volume during a bullish or bearish sentiment phase is a strong confirmation of a market sentiment shift. This integration enhances the reliability of the buy and sell signals generated by the sentiment cycle logic.
4. Sentiment Cycles:
• The indicator identifies four main sentiment phases—Optimism, Excitement, Panic, and Depression—based on combinations of RSI, MACD, and volume data. These phases are visually represented on the chart through background color zones, allowing traders to see the prevailing market sentiment at a glance.
• Integration: The sentiment phases are determined by a combination of the RSI trend, MACD crossovers, and volume analysis. For example, a transition from “Panic” to “Optimism” is detected when the RSI recovers from oversold levels, MACD turns bullish, and volume spikes decrease. This comprehensive approach ensures that all signals are well-founded and based on multiple dimensions of market data.
5. Buy and Sell Signals:
• The buy and sell signals are generated based on crossovers and crossunders between sentiment phases. For example, a buy signal is triggered when the market moves from a “Depression” (oversold) phase to an “Optimism” phase. A sell signal is triggered when the market transitions from “Excitement” to “Panic.”
• Integration: These signals are refined by adding a minimum distance between consecutive signals to avoid noise and enhance the clarity of trading opportunities. This further ensures that signals are not generated too frequently, reducing the chance of false positives.
Justification for Combining These Components:
The combination of RSI, MACD, volume analysis, and sentiment detection into a single indicator offers a holistic approach to understanding market psychology. Here’s why this mashup is particularly effective:
• Comprehensive Sentiment Analysis: The integration of RSI and MACD provides a well-rounded view of both momentum and trend, while volume analysis adds a layer of intensity to confirm sentiment shifts.
• Reduced Noise and Enhanced Signal Quality: By using multiple indicators to filter signals, the indicator minimizes noise and reduces the likelihood of false signals. This is particularly beneficial for traders looking to capitalize on meaningful market turns rather than being whipsawed by minor fluctuations.
• Visual Clarity: The background color zones corresponding to different sentiment phases offer a clear, at-a-glance view of the market’s current state, allowing traders to make more informed decisions quickly.
• Unique Combination for Market Sentiment Detection: While many indicators focus on either trend, momentum, or volume independently, this mashup uniquely combines these elements to detect the market’s underlying emotional state, providing a more nuanced understanding of market behavior.
How to Use This Indicator:
• Buy Signal: Look for the green “Buy” label when the market transitions from a bearish sentiment (grey or red zones) to a bullish sentiment (green zone).
• Sell Signal: Look for the red “Sell” label when the market transitions from a bullish sentiment (blue zone) to a bearish sentiment (red or gray zones).
• Dynamic Background Zones: Use the background color zones to visually track the prevailing market sentiment phase and anticipate potential buy or sell signals.
Originality and Practical Application:
This indicator’s originality lies in its ability to seamlessly integrate multiple widely-used technical analysis tools (RSI, MACD, and Volume) into a single, comprehensive tool for detecting market sentiment shifts. By doing so, it provides traders with a practical, easy-to-use tool that adapts to various market conditions, making it suitable for both day trading and longer-term strategies.
Conclusion:
The “Sentiment Cycle Indicator” is designed to offer traders a powerful, unified approach to identifying market sentiment shifts. By combining momentum, trend, and volume analysis, it delivers a unique and efficient way to navigate the complexities of market psychology, ultimately providing traders with an edge in understanding and predicting market movements.

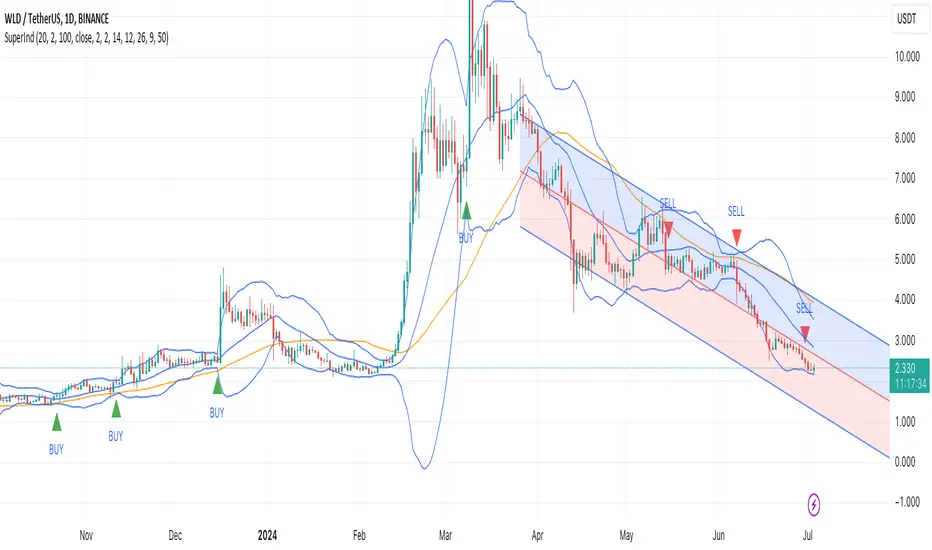
Super IndicatorOverview of the Combined Indicator
This combined indicator leverages three major technical analysis tools:
Bollinger Bands
Linear Regression Channels
Scalping Strategy Indicators (RSI, MACD, SMA)
Each of these tools provides unique insights into market conditions, and their integration offers a comprehensive view of price movements, trends, and potential trading signals.
1. Bollinger Bands
Purpose:
Bollinger Bands are used to measure market volatility and identify overbought or oversold conditions.
Components:
Basis (Middle Band): Typically a 20-period Simple Moving Average (SMA).
Upper Band: Basis + (2 * Standard Deviation).
Lower Band: Basis - (2 * Standard Deviation).
Why They Complement:
Bollinger Bands expand and contract based on market volatility. When the bands are narrow, it indicates low volatility and potential for a significant move. Wide bands indicate high volatility. This helps traders gauge the strength of market moves and potential reversals.
2. Linear Regression Channels
Purpose:
Linear Regression Channels identify the overall trend direction and measure deviation from the mean price over a specific period.
Components:
Middle Line (Linear Regression Line): The line of best fit through the price data over a specified period.
Upper and Lower Lines: Channels created by adding/subtracting a multiple of the standard deviation or another deviation measure from the regression line.
Why They Complement:
Linear Regression Channels provide a clear visual representation of the trend direction and the range within which prices typically fluctuate. This can help traders identify trend continuations and reversals, making it easier to spot entry and exit points.
3. Scalping Strategy Indicators
Purpose:
The RSI, MACD, and SMA are used to generate short-term buy and sell signals, which are essential for scalping strategies aimed at capturing quick profits from small price movements.
Components:
RSI (Relative Strength Index): Measures the speed and change of price movements, typically over 14 periods. It helps identify overbought and oversold conditions.
MACD (Moving Average Convergence Divergence): Consists of the MACD line, Signal line, and histogram. It helps identify changes in the strength, direction, momentum, and duration of a trend.
SMA (Simple Moving Average): The average price over a specified period, used to smooth out price data and identify trends.
Why They Complement:
These indicators provide short-term signals that can confirm or refute the signals given by Bollinger Bands and Linear Regression Channels. For example, a buy signal might be more reliable if the price is near the lower Bollinger Band and the MACD crosses above its signal line.
How They Work Together
Scenario 1: Confirming Trend Continuations
Bollinger Bands: Price staying near the upper band suggests a strong uptrend.
Linear Regression Channels: Price staying above the middle line confirms the uptrend.
5-Minute Scalping Strategy: RSI not in overbought territory, and MACD showing bullish momentum confirms continuation.
Scenario 2: Identifying Reversals
Bollinger Bands: Price touching or moving outside the lower band suggests oversold conditions.
Linear Regression Channels: Price at the lower channel line indicates potential support.
5-Minute Scalping Strategy: RSI in oversold territory, and MACD showing a bullish crossover indicates a reversal.
Scenario 3: Volatility Breakouts
Bollinger Bands: Bands contracting indicates low volatility and potential breakout.
Linear Regression Channels: Price moving away from the middle line signals potential breakout direction.
Scalping Strategy: MACD and RSI confirming the breakout direction for entry.
Input Parameters:
Define settings for Bollinger Bands, Linear Regression Channels, and the scalping strategy.
Allow users to customize lengths, multipliers, and colors.
Bollinger Bands Calculation:
Calculate the basis (SMA) and standard deviation.
Derive the upper and lower bands from the basis and standard deviation.
Linear Regression Channel Calculation:
Compute the slope, average, and intercept of the linear regression line.
Calculate deviations to plot upper and lower channel lines.
5-Minute Scalping Strategy:
Calculate RSI, MACD, and SMA for short-term trend analysis.
Define buy and sell conditions based on these indicators.
Plotting and Alerts:
Plot Bollinger Bands and Linear Regression Channels on the chart.
Plot buy and sell signals with shapes.
Set alerts for key conditions like exiting the regression channel bounds and trend switches.
Conclusion
By combining Bollinger Bands, Linear Regression Channels, and a 5-minute scalping strategy, this indicator offers a robust tool for traders. Bollinger Bands provide volatility insights, Linear Regression Channels highlight trend direction and potential reversals, and the scalping strategy offers precise entry and exit points. Together, these tools can enhance a trader's ability to make informed decisions in various market conditions.
[r380]Bear & Bull Pivot Signal Indicator_(Lite))Bear & Bull Pivot Signal Indicator
Overview:
The Bear & Bull Multi Pivot Signal Indicator is a comprehensive trading tool designed to identify potential market reversal points and trend changes. This indicator combines multiple technical analysis strategies such as RSI, MACD, and pivot points to generate reliable signals. By overlapping these signals, the indicator increases the possibility of accurate trend predictions, providing traders with valuable insights for informed decision-making.
"This indicator is primarily optimized for Bitcoin on a 15-minute timeframe and is recommended for short-term trading. Reliability on other timeframes is not guaranteed."
Key Features:
Bear and Bull Signals: Clearly indicate potential market reversal points using bear and bull emojis.
Support and Resistance Signals: Indicated with sun and snowflake emojis to show critical price levels.
Overheat Cooldown Pivot: Detects market exhaustion points to signal potential reversals.
Settings:
RSI Settings: Adjust the RSI period and thresholds to match your trading strategy. Default values are optimized for short-term trading.
MACD Settings: The MACD settings are pre-configured but can be customized if needed.
Visual Settings: If excessive signals cause visual discomfort, you can selectively enable or disable features in the visual settings.
Signal Descriptions:
🐻 Bear Signal: Indicates a potential high point where the market may reverse downwards. Combines RSI and MACD conditions to provide a reliable overbought signal. When accompanied by high volume, it can indicate a strong resistance level.
🐮 Bull Signal: Indicates a potential low point where the market may reverse upwards. Uses both RSI and MACD conditions to highlight oversold situations. When accompanied by high volume, it can indicate a strong support level.
❄️ Resistance Signal: Shows a resistance level where the price has difficulty moving higher. When the price crosses below this level, it signals a potential downward movement. Combined with high volume, it can signify robust resistance.
☀️ Support Signal: Shows a support level where the price has difficulty moving lower. When the price crosses above this level, it signals a potential upward movement. Combined with high volume, it can signify strong support.
Detailed Explanation:
This indicator is not simply a combination of multiple indicators but is designed to increase the probability of detecting potential trend reversal signals by using multiple signals. If signals only appear when multiple conditions are met, how many trades can we make in a year? Because there is no 100% certainty in any situation, we need to use various signals to construct our strategy and proceed with trading. For example, if only one signal appears, the reliability of the trend reversal signal is somewhat weak, so we can strategize by betting only a portion of the capital. If multiple signals appear simultaneously, we can consider it a highly reliable trend reversal signal and increase the betting amount and stop loss accordingly. The essence of this indicator, in my view, is not to blindly trade based on signals but to use it as an auxiliary tool for strategic decision-making.
RSI (Relative Strength Index), MACD, and Stochastic RSI: By using various indicators to confirm trend reversal signals, bear and bull emojis are included. If the RSI reaches an oversold zone and then drops by a certain amount, while the MACD turns negative and the Stochastic RSI makes a gold or dead cross, the bear and bull signals are activated.
Pivot Points: Calculated based on the high, low, and close prices over a specific lookback period. These points are used to determine support and resistance levels. Pivot points provide a framework for assessing market sentiment and potential reversal zones. The values calculated this way activate the sun and snowflake signals.
The Overheat Cooldown Pivot: captures moments when the market shows signs of exhaustion, particularly when overbought or oversold conditions are accompanied by a drop in volume. This helps traders anticipate market turning points more effectively. These signals appear as red or green triangles indicating potential reversals. Although similar to the bear and bull signals in detecting market cool-off points, these signals rely on volume and may have slightly lower reliability.
Practical Application:
By using this indicator, traders can strategically adjust their bet sizes based on the reliability of the signals. When multiple signals coincide, it indicates a higher probability of a trend reversal, allowing for larger position sizes. Conversely, when signals occur independently, it suggests a lower probability, warranting smaller position sizes. This approach enables traders to manage their risk effectively and capitalize on high-probability trading opportunities without excessively reducing trading frequency.
Trading Method:
The basic setup is for Bitcoin on a 15-minute timeframe, and short-term trading is recommended by the creator. Upon signal activation, if only one signal appears, verify the volume and support/resistance lines, calculate the risk-reward ratio, and enter a position with a low betting ratio. If three signals activate simultaneously, enter a position with a higher betting ratio.
Reliability Order:
🐻🐮 > ❄️☀️ > 🔻🔺 (replacing green triangle emojis)
This indicator provides a powerful method for detecting multiple potential market reversals and trend continuations.
Note: Have realistic expectations and understand the limitations of technical analysis tools. This indicator is a tool to assist in your trading decisions and not a guaranteed prediction of market movements.
Warning! Do not trade solely based on this indicator.
Additionally, if you find the settings lacking, feel free to adjust them yourself! Thank you!
Korean Version
곰돌이와 송아지 멀티 피봇 시그널 인디케이터
개요:
곰돌이와 송아지 멀티 피봇 시그널 인디케이터는 잠재적 시장 반전 지점과 추세 변화를 식별하기 위해 설계된 종합 거래 도구입니다. 이 인디케이터는 RSI, MACD, 피봇 포인트 등의 여러 기술 분석 전략을 결합하여 신뢰할 수 있는 신호를 생성합니다. 이러한 신호들을 중첩함으로써 정확한 추세 예측의 가능성을 높여, 트레이더가 정보를 기반으로 결정을 내리는 데 유용한 통찰력을 제공합니다.
기본적으로 비트코인 15분봉을 기준으로 하며 매매 방법은 단타를 권장합니다. 다른 타임프레임에서의 신뢰는 보장 하지 않습니다.
주요 기능:
곰돌이와 송아지 신호: 시장의 잠재적 반전 지점을 곰돌이와 송아지 이모지로 명확하게 표시합니다.
지지 및 저항 신호: 중요한 가격 수준을 나타내기 위해 태양과 눈송이 이모지로 표시합니다.
오버히트 쿨다운 피봇: 시장 피로 지점을 감지하여 잠재적 반전 신호를 제공합니다.
세팅방법:
RSI 설정: RSI 기간과 임계값을 조정하여 자신의 거래 전략에 맞춥니다. 기본값은 단기 거래에 최적화되어 있습니다.
MACD 설정: MACD 설정은 미리 구성되어 있으며, 필요에 따라 사용자 정의가 가능합니다.
비쥬얼 세팅: 과도한 시그널 때문에 눈이 아프시다면 비쥬얼세팅에서 선택적으로 기능들을 켜거나 끌 수 있으니 참고하세요.
신호 설명:
🐻 곰돌이 신호: 시장이 하락할 가능성이 있는 고점을 나타냅니다. RSI와 MACD 조건을 결합하여 신뢰할 수 있는 과매수 신호를 제공합니다. 높은 거래량과 함께 나타나면 강한 저항 수준을 나타낼 수 있습니다.
🐮 송아지 신호: 시장이 상승할 가능성이 있는 저점을 나타냅니다. RSI와 MACD 조건을 사용하여 과매도 상황을 강조합니다. 높은 거래량과 함께 나타나면 강한 지지 수준을 나타낼 수 있습니다.
❄️ 저항 신호: 가격이 더 이상 상승하기 어려운 저항 수준을 나타냅니다. 가격이 이 수준 아래로 하락하면 잠재적 하락 움직임을 신호합니다. 높은 거래량과 함께 나타나면 강력한 저항을 의미할 수 있습니다.
☀️ 지지 신호: 가격이 더 이상 하락하기 어려운 지지 수준을 나타냅니다. 가격이 이 수준 위로 상승하면 잠재적 상승 움직임을 신호합니다. 높은 거래량과 함께 나타나면 강한 지지를 의미할 수 있습니다.
상세 설명:
이 인디케이터는 여러 인디케이터를 단순히 결합한 것이 아니라, 여러가지 시그널들을 사용해서 잠재적 추세전환 신호 감지 확률을 높이는 것에 목적이 있습니다. 단순히 여러가지 조건들이 중첩되었을때만 신호가 뜬다면 우리는 1년에 몇번이나 매매를 할 수 있을까요. 모든경우에 100% 라는 경우가 없기때문에 우리는 다양한 신호들을 활용하여 전략을 구성하고 매매를 진행 해야합니다. 예를들어 1개의 시그널만 뜬다면 추세전환 신호의 신뢰도가 다소 약하기 때문에 시드의 일부 금액만 배팅 하는 식으로 전략을 구성 할 수도 있고, 만약 여러가지 시그널들이 충접적으로 뜬다면 신뢰도 높은 추세전환의 신호로 인식하여 배팅금액을 높이고 스탑로스를 높게 잡는 방향으로 전략을 구성 할 수 있습니다. 단순히 맹목적으로 시그널이 떳다고 매매하는것이 아닌 보조 신호로써의 기능, 이것이 내가 생각하는 인디케이터의 역할이자 본질 이라고 생각합니다.
RSI (상대 강도 지수)와 MACD, 스토캐스틱 RSI: 여러가지 지표들을 기반으로 추세 반전의 신호를 확인 할 수 있는 곰돌이와 송아지를 넣었습니다. RSI 가 과매도 구간에 도달한 이후일정 수치 이상 하락하는 동시에 MACD가 음수로 변하고 스토캐스틱 RSI가 골드, 데드 크로스가 된다면 곰돌이와 송아지 신호가 활성화 됩니다.
피봇 포인트: 특정 되돌아보기 기간 동안의 최고, 최저, 종가를 기반으로 계산됩니다. 이 포인트는 지지 및 저항 수준을 결정하는 데 사용됩니다. 피봇 포인트는 시장 심리와 잠재적 반전 영역을 평가하는 프레임워크를 제공합니다. 이렇게 계산된 값을 기반으로 눈송이와 해 신호가 활성화 됩니다.
오버히트 쿨다운 피봇: 는 과매수 또는 과매도 상태에서 거래량이 감소할 때 시장 피로 지점을 포착하여 잠재적 반전 지점을 신호합니다. 이러한 피로 지점을 식별함으로써 인디케이터는 트레이더가 시장의 전환점을 보다 효과적으로 예측할 수 있도록 돕습니다. 그렇게 추세 반전의 신호로 녹색 또는 붉은색 삼각형 시그널이 뜹니다. 과열된 시장이 냉각되는 포인트를 찾는점에서는 곰돌이 송아지 신호와 비슷하지만 거래량을 기반으로 하고 있기 때문에 명백히 다른 시그널이며 신뢰도는 약간 낮을 수도 있습니다
실용적 적용:
이 인디케이터를 사용함으로써, 트레이더는 신호의 신뢰도에 따라 베팅 크기를 전략적으로 조정할 수 있습니다. 여러 신호가 동시에 나타날 때, 이는 추세 반전의 가능성이 높음을 나타내며, 더 큰 포지션 크기를 허용합니다. 반대로, 신호가 독립적으로 발생할 때는 낮은 가능성을 나타내므로 작은 포지션 크기가 적합합니다. 이 접근 방식은 트레이더가 효과적으로 리스크를 관리하고 높은 확률의 거래 기회를 활용하면서 거래 빈도를 과도하게 줄이는 것을 방지할 수 있게 합니다.
매매방법:
기본적인 세팅은 비트코인 15분 타임프레임이며 제작자는 단타를 추천합니다. 포지션 진입시 시그널이 1개가 뜬다면 거래량과 지지와 저항라인을 확인하고 손익비를 계산후 낮은 배팅 비율로 포지션에 진입합니다. 만약에 3개의 시그널이 동시에 활성화 된다면 보다 높은 비율로 포지션에 진입합니다.
신뢰도 순서:
]🐻🐮 > ❄️☀️ > 🔻🔺(초록 삼각이모지가 없기때문에 이것으로 대체)
이 지표는 여러 잠재적인 시장 반전 및 추세 지속성을 감지하는 강력한 방법을 제공합니다.
참고: 현실적인 기대를 가지고 기술 분석 도구의 한계를 이해하십시오. 이 지표는 시장 움직임을 보장하는 예측이 아니라 거래 결정을 돕기 위한 도구입니다.
경고! 절대 이 지표만을 가지고 매매하지 마십쇼.
추가적으로 제작자는 지표 세팅에 허접이라 꼬우면 당신이 세팅하십쇼! 감사합니다!

ZenThe Theory of Entanglement (缠论) is one of the most widely studied trading theories in China, but it is much less known among traders outside. Its philosophy is based on human greed, hatred, delusion, arrogance and doubt, which reveal the most fundamental aspect of the market. Fractals, strokes, line segments and pivots are basic elements in the Theory of Entanglement. However, manually drawing them on an ever-changing chart is both challenging and time consuming, and may lead to incorrect interpretation of the market trend. This indicator aims to automate the process of drawing strokes, line segments, and pivots for three consecutive levels such as 1m, 5m, and 30m (similar to time frames). The operation is then based on the so-called “same-level decomposition” technique. Buying and selling points are automatically marked on the chart, as well as points where trend divergence and range divergence occurred, which often signals a trend reversal.
Relations between fractal, stroke, line segment, pivot, and some important definitions:
• Stroke: Connecting two adjacent top and bottom fractals with at least one candlestick in between.
• Line segment: Consists of an odd number of strokes, at least three strokes are required, and the first three strokes must have overlapping parts.
• Level: Levels generally correspond to time frames of the chart, such as 1w, 1d, 4h, 30m, 5m, 1m etc. Sub-level: The above levels are respectively the sub-levels of the previous level.
• Pivot: The part of a trend type at a certain level that is overlapped by at least three consecutive sub-level trend types.
• Trend type: There are two trend types: trend and range. In trend, there are also two types: rising trend and falling trend.
• Range: At any level, a completed trend type contains only one pivot.
• Trend: At any level, a completed trend type contains at least two pivots in the same direction in sequence, which is called a trend at this level.
List of drawings on the chart:
1. Thin black lines: Strokes at the current level.
2. Thick blue lines: Strokes at a higher level, also line segments at the current level.
3. Purple dotted lines: Line segments at a higher level, also strokes at two levels higher from the current one.
4. Blue shaded rectangles: Pivots at the sub-level in a rising trend or range.
5. Red shaded rectangles: Pivots at the sub-level in a falling trend or range.
6. Green shaded rectangles: Pivots at the current level in a rising trend or range.
7. Orange shaded rectangles: Pivots at the current level in a falling trend or range.
List of symbols and labels on the chart (above the candle: sell signal, below the candle: buy signal)
1. Purple triangles below the candle: double golden cross of Stochastic and MACD, buy signal
2. Purple triangles above the candle: double death cross of Stochastic and MACD, sell signal
3. Blue triangles below the candle: EMA5 crosses EMA13 up, buy signal
4. Red triangles above the candle: EMA5 crosses EMA13 down, sell signal
5. Green triangles below the candle: EMA5 crosses EMA55 up, buy signal
6. Orange triangles above the candle: EMA5 crosses EMA55 down, sell signal
7. Blue circles on the low point of the candle: bottom divergence occurred, buy signal
8. Red circles on the high point of the candle: top divergence occurred, sell signal
9. Blue "R" label below the candle: bottom divergence calculated from RSI occurred, buy signal
10. Red "R" label above the candle: top divergence calculated from RSI occurred, sell signal
11. Blue "M" label below the candle: bottom divergence calculated from MACD occurred, buy signal
12. Red "M" label above the candle: top divergence calculated from MACD occurred, sell signal
13. Blue "RM" label below the candle: bottom divergence calculated from both RSI and MACD occurred, buy signal
14. Red "RM" label above the candle: top divergence calculated from both RSI and MACD occurred, sell signal
15. Blue "1(R)", "1(M)", "1(RM)" labels below the candle: 1st buying point due to bottom trend divergence or range divergence calculated from RSI, MACD, and both RSI and MACD occurred, respectively, buy signal
16. Red "1(R)", "1(M)", "1(RM)" labels above the candle: 1st selling point due to top trend divergence or range divergence calculated from RSI, MACD, and both RSI and MACD occurred, respectively, sell signal
17. Blue "3" label below the candle: 3rd buying point, buy signal
18. Red "3" label above the candle: 3rd selling point, sell signal
19. Green "3" label below the candle: 3rd buying point of a higher-level pivot, buy signal
20. Orange "3" label above the candle: 3rd selling point of a higher-level pivot, sell signal
21. Yellow-shaded vertical areas: candles where volume spikes occurred
22. Short red horizontal lines: highest point of volume spikes, potential support or resistance
23. Short blue horizontal lines: lowest point of volume spikes, potential support or resistance
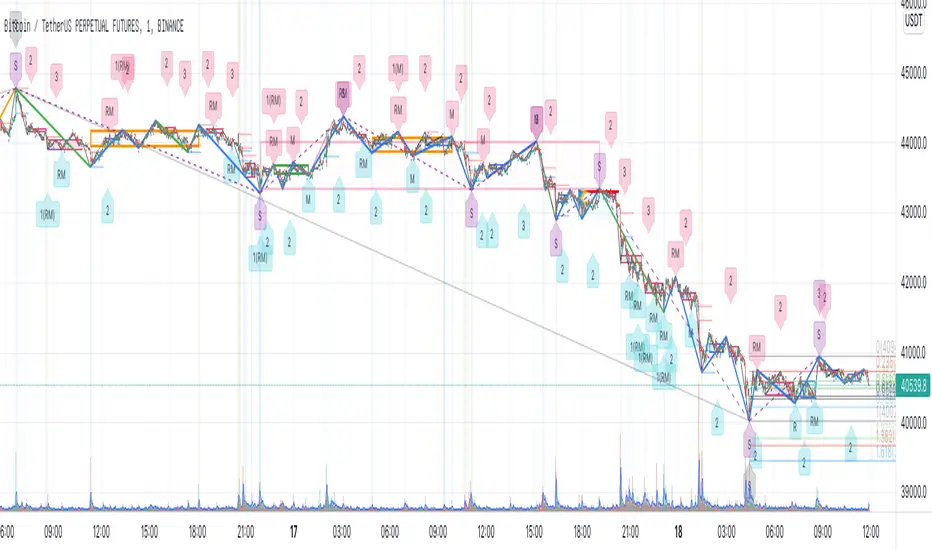
[SignalFI] MACD+RSI+MA Trend [V1.0]Welcome,
Proud to release a trending analysis tool for looking at the popular strategy of RSI + MACD + 12/26 EMA moving averages. The script is a unified trend script that shows:
- 12/26 EMA Trend
- MACD Crossovers
- MACD Histogram Pivots
- RSI Overbought (RSI > 70 = White Candles)
- RSI Oversold (RSI < 30 = Deep Blue Candles)
- RSI Pivots
Collectively, this allows you to implement and alert on one of the most popular and widely use strategies, all from one script.
In addition, we've added a third EMA moving average (Default 9 Candle EMA) that represents the MACD signal line on the chart. This line will change color to denote whether the MACD signal line is rising or falling compared to the previous candle (represented by the 'circles trend line' on the graph).
Script is fully alerted:
1) Bull MACD X
2) Bear MACD X
3) MACD Histo Pivot (Bull/Bear)
4) RSI Pivot (Bull/Bear)
5) Signal Line X (Bull/Bear)
Enjoy!
SignalFI was created to help traders and investors to effectively analyze the market based on the Golden Mean Ratio (Fibonacci numbers), plan a trade and ultimately execute it. To help inform and educate market decisions we developed a set of Trading Indicators which are available on TradingView , the most advanced and yet easy to use charting platform available on the web.
SignalFI indicators are just that, indicators. Our indicators are generally configured to use completely historical data (negating repaint), and we advise all alerts created with SignalFI indicators to be fired upon "close" of the current candle. Our indicators can provide valuable context and visualization support when performing market analysis and executing buy and sell decisions. However. we are not financial experts, and all information presented on this site or our other media outlets are for educational purposes only.
For subscription information, visit www.signalfi.net and follow us on twitter .

CloudScore by ExitAnt [Upgrade]📘 CloudScore PRO by ExitAnt (v13)
CloudScore PRO는 일목균형표(REAL Ichimoku Cloud)의 ‘진짜 상방 돌파’만을 감지하고,
여기에 총 10가지 추세·모멘텀·패턴·거래량 요소를 점수화하여 (0~9점)
현재 추세 전환의 강도를 직관적으로 알려주는 고급 추세 분석 지표입니다.
일목 구름은 본래 강력한 추세 전환 신호를 제공하지만
“위→안→위” 또는 “부분 돌파” 같은 왜곡 신호가 매우 많습니다.
v13은 이를 완전히 제거하고,
오직 아래→안→위 또는 아래→위(직통) 형태의 ‘진짜 돌파’에서만 점수를 계산합니다.
🎯 지표 목적
* 진짜 일목구름 돌파만 필터링하여 신뢰도 상승
* 10개 기술 요소의 점수화(0~9점)로 한눈에 추세 강도 판단
* 거짓 진입 신호(위→안→위) 완전 제거
* 점수 0일 때도 ‘🔴’로 명확하게 무효 신호 표시
* 초보자부터 숙련자까지 모두 활용 가능한 추세 진입 필터링 지표
🧠 점수 계산 방식 (가중치 기반)
구름 돌파가 유효하게 발생하면,
아래 10가지 조건을 체크하여 각 항목별 가중치 점수가 합산됩니다.
▶ 기존 +1 점 항목 (5개)
1. 골든 크로스 발생
Fast MA가 Slow MA를 최근 N봉 내 상향 돌파
2. RSI 과매도 구간
RSI < 설정값 → 반등 가능성 증가
3. MACD 강세 전환
MACD < 0 & 시그널 상향 돌파
4. RSI 상승 다이버전스
가격 하락, RSI 상승 → 바닥 가능성
5. 종가 > MA200
장기 추세와 일치하는 경우만 점수 강화
▶ 신규 +1 점 항목 (추가 5개)
6. ADX > 20 (추세 강도)
추세가 실제로 형성되고 있을 때
7. 거래량 스파이크 발생
거래량이 평균 대비 일정 배수 이상 증가 → 큰 매수 유입
8. Stochastic Oversold Cross
%K < 30에서 골든크로스 → 저점 반등 신호
9. Bollinger Band Rebound
이전 봉이 하단 밴드를 이탈하고, 현재 봉이 중심선을 회복한 경우
10. 강세 캔들 패턴 (Bullish Engulfing / Hammer 등)
강한 반전 패턴 발생 시
> 점수는 단순 +1 합산이 아니라
> 각 요소의 중요도에 따른 가중치 합산 방식으로 계산됩니다.
📊 점수별 이모지 (8단계)
| 점수 구간 | 이모지 | 의미 |
| -------- | ------ | -------------- |
| ≤ 0 | 🔴 | 무효 신호 |
| 0 ~ 1 | ⚪ | 매우 약함 |
| 1 ~ 2 | 🟡 | 약함 |
| 2 ~ 3 | 🟢 | 관찰 필요 |
| 3 ~ 4 | 🔵 | 양호 |
| 4 ~ 5 | 📈 | 추세 형성 |
| 5 ~ 6.5 | 🚀 | 매우 강함 |
| **6.5+** | **👑** | **최상급 고신뢰 구간** |
> 👑 이모지는 6.5점 초과에서만 표시되며,
> 여러 핵심 조건이 동시에 충족된 극소수 구간에서만 나타납니다.
🖥 차트 표시 요소
* REAL Ichimoku Cloud(미래 이동 없는 실제 구름)을 기반으로 계산
* TRUE breakout(아래 → 위 돌파) 시 캔들 위에 점수 이모지 표시
* 최근 N개의 캔들만 표시 가능
* 우측 상단에 현재 점수 요소 설명 패널 표시
* 점수 0점일 때도 🔴 표시하여 신호의 부재를 명확히 표현
* 위→안→위처럼 잘못된 돌파는 완전히 제외됨
🔧 사용자 설정
* Tenkan / Kijun / SenkouB 기간 설정
* 점수 요소 개별 활성화/비활성화
* 이모지 커스터마이즈
* 최근 몇 개의 캔들까지 표시할지 설정
* MA, RSI, MACD, ADX, Bollinger 등 점수 요소 사용자 정의 가능
⚠️ 유의사항
이 지표는 일목구름 돌파 기반의 확률적 보조 도구이며,
단독으로 매수·매도 결정을 내리는 용도로 사용해서는 안 됩니다.
* 시장 변동성
* 시간 프레임
* 거래량 환경
에 따라 신호 강도는 달라질 수 있습니다.
실제 매매 적용 전 반드시 백테스트 및 시뮬레이션을 권장합니다.
오케이. 그럼 **지금 네 코드(v13, 가중치 + 8단계 이모지 기준)** 와
**완전히 1:1로 맞는 영어 설명 최종본**을 줄게.
(퍼블릭 배포용으로 그대로 써도 되는 수준)
# 📘 **CloudScore PRO by ExitAnt (v13)**
CloudScore PRO is an advanced **Ichimoku-based trend scoring indicator**
that detects only **true, valid Ichimoku Cloud breakouts** and evaluates the
strength of the trend using a **weighted score system built from 10 technical components**.
Unlike standard Ichimoku signals — which often generate distorted breakouts such as
**“above → inside → above”** —
CloudScore PRO v13 **filters these out completely** and only accepts the following structures as valid breakouts:
* **below → inside → above**
* **below → above (direct breakout)**
This ensures that scoring is applied **only when a genuine trend transition occurs**.
## 🎯 Purpose of the Indicator
* Filter out false Ichimoku Cloud breakouts
* Evaluate trend strength using **10 weighted confirmation signals**
* Visualize trend quality instantly using **8-stage emoji scoring**
* Clearly mark invalid signals (score ≤ 0)
* Serve as a robust **entry filter** for both beginners and advanced traders
## 🧠 Scoring Logic (Weighted System)
When a valid cloud breakout occurs, CloudScore PRO evaluates the following
10 components and **adds weighted scores based on their importance**.
### ▶ Core Trend & Momentum Components (5)
1. **Golden Cross**
* Fast MA crosses above Slow MA within the defined lookback period
2. **RSI Oversold Condition**
* RSI below threshold, indicating potential reversal
3. **MACD Bullish Shift**
* MACD below zero with bullish signal-line crossover
4. **RSI Bullish Divergence**
* Price makes a lower low while RSI makes a higher low
5. **Close Above MA200**
* Price aligned with the long-term trend direction
### ▶ Additional Confirmation Components (5)
6. **ADX Trend Strength**
* Confirms that a real trend is forming
7. **Volume Spike**
* Significant increase in trading volume vs average
8. **Stochastic Oversold Cross**
* %K crosses upward below the 30 level
9. **Bollinger Band Rebound**
* Price recovers after breaking below the lower band
10. **Bullish Candlestick Pattern**
* Engulfing, Hammer, or similar reversal patterns
> Scores are **not simple +1 increments**.
> Each component contributes a **weighted value**, reflecting its real-world importance.
## 📊 Emoji Score System (8 Levels)
| Score Range | Emoji | Meaning |
| ----------- | ------ | ---------------------------------- |
| ≤ 0 | 🔴 | Invalid / no signal |
| 0 ~ 1 | ⚪ | Very weak |
| 1 ~ 2 | 🟡 | Weak |
| 2 ~ 3 | 🟢 | Moderate |
| 3 ~ 4 | 🔵 | Decent |
| 4 ~ 5 | 📈 | Trend forming |
| 5 ~ 6.5 | 🚀 | Very strong |
| **6.5+** | **👑** | **Premium, high-confidence setup** |
👑 **The crown emoji appears only when the total weighted score exceeds 6.5**,
meaning multiple high-importance conditions are aligned simultaneously.
This prevents “emoji inflation” and ensures that premium signals remain rare and meaningful.
## 🖥 Chart Features
* Uses **REAL Ichimoku Cloud** (no future displacement)
* Displays score emojis directly on breakout candles
* Supports LONG / SHORT / BOTH modes
* Optional display limited to the most recent N bars
* Top-right panel explains scoring structure and logic
* Completely ignores false breakouts (above → inside → above)
## 🔧 User Options
* Adjust Ichimoku, MA, RSI, MACD, ADX parameters
* Enable or disable individual scoring components
* Fully customize emoji symbols
* **Display only signals above a chosen minimum score**
* e.g. show only 👑 setups by setting minimum score to 6.5
## ⚠️ Disclaimer
CloudScore PRO is a **probability-based trend evaluation tool**,
not a standalone buy or sell signal.
Signal strength may vary depending on:
* Market volatility
* Timeframe
* Volume environment
Always perform proper backtesting and apply sound risk management
before using this indicator in live trading.
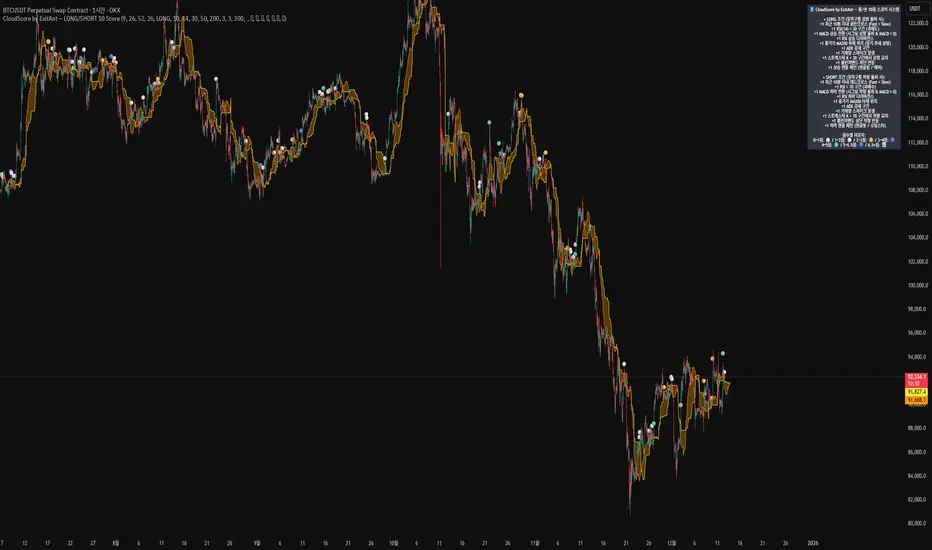
CloudScore by ExitAnt📘 CloudScore by ExitAnt
CloudScore by ExitAnt 는 일목균형표(Ichimoku Cloud)의 구름대 돌파 신호를 기반으로,
다양한 추세 보조지표를 결합하여 매수 추세 강도를 점수화(0~5점) 해주는 트렌드 분석 지표입니다.
기존 일목구름 단독 신호는 변동성이 크거나 신뢰도가 낮을 수 있기 때문에,
이 지표는 여러 기술적 요소를 종합적으로 평가하여
“지금이 얼마나 강력한 추세 전환 구간인가?” 를 직관적으로 보여줍니다.
🎯 지표 목적
일목균형표 구름 돌파의 신뢰도 강화
보조지표 신호를 자동으로 점수화하여 한눈에 판단 가능
캔들 위에 이모지를 배치해 시각적으로 즉시 해석 가능
초보자부터 숙련자까지 모두 활용 가능한 추세 진입 필터링 도구
🧠 점수 계산 방식 (0~5점)
구름 상향 돌파가 발생하면 아래 조건들을 체크하여 점수를 부여합니다.
▶ +1점 조건 항목
1. 골든 크로스 발생
* 최근 설정한 n봉 이내에서 Fast MA가 Slow MA를 상향 돌파한 경우
2. RSI 과매도 구간
* RSI가 설정 값 이하일 때 추세 전환 가능성이 증가
3. MACD 강세 전환
* MACD가 0 아래에 있으면서 시그널선 상향 돌파 발생
4. RSI 상승 다이버전스
* 가격은 낮아지지만 RSI는 상승 → 바닥 신호
5. 200MA 위에 위치
* 장기 추세와 일치하는 시점만 점수 강화
▶ 점수별 이모지
1점 🟡 : 약한 진입 신호
2점 🟢 : 관찰이 필요한 강화 신호
3점 📈 : 추세 전환 가능성 증가
4점 🚀 : 강한 추세 신호
5점 👑 : 매우 강력한 진입 시그널
🖥 차트 표시 요소
구름대(Span A / Span B)만 표시하여 더 깔끔한 시각화
이모지는 캔들 위에 자동 배치
필요 시 최근 n개의 캔들만 표시하도록 설정 가능
오른쪽 상단에 조건 요약 안내창 표시
🔧 사용자 설정
Tenkan / Kijun / SenkouB 기간 조정
MA, RSI, MACD, 다이버전스 사용 여부 선택
최근 몇 개의 캔들까지 점수를 표시할지 설정 가능
이모지는 사용자 취향에 따라 변경 가능
⚠️ 유의사항
본 지표는 **가격 움직임의 확률적 해석을 돕는 보조지표**이며, 단독으로 매수·매도 결정을 내려서는 안 됩니다.
시장 상황(변동성, 거래량, 프레임)에 따라 신호의 신뢰도는 달라질 수 있습니다.
실제 매매 전략에 적용하기 전 반드시 백테스트와 검증이 필요합니다.
# **📘 CloudScore by ExitAnt — English Description**
📘 CloudScore by ExitAnt
CloudScore by ExitAnt is a trend analysis indicator that evaluates bullish trend strength by scoring (0–5 points) signals based on Ichimoku Cloud breakouts combined with multiple momentum and trend indicators.
Since the default Ichimoku Cloud breakout alone can be unreliable or highly volatile, this indicator integrates several technical conditions to visually and intuitively show
“How strong is the current trend reversal opportunity?”
🎯 Purpose of the Indicator
Enhance the reliability of Ichimoku Cloud breakout signals
Automatically score multiple signals for quick visual judgment
Place emojis directly above candles for instant interpretation
Works for both beginners and experienced traders as a trend-entry filtering tool
🧠 Scoring Logic (0–5 points)
When a bullish breakout above the cloud occurs, the indicator checks the following conditions and assigns points.
▶ +1 Point Conditions
1. Golden Cross
* Fast MA crosses above Slow MA within the user-defined lookback window
2. RSI Oversold
* RSI below threshold increases the probability of trend reversal
3. MACD Bullish Shift
* MACD is below zero while crossing above the signal line
4. RSI Bullish Divergence
* Price makes a lower low while RSI makes a higher low → potential bottom signal
5. Above the 200MA
* Only scores when price aligns with long-term trend direction
▶ Emoji by Score
1 Point 🟡 : Weak early signal
2 Points 🟢 : Improved setup; watch closely
3 Points 📈 : Decent trend reversal possibility
4 Points 🚀 : Strong trend entry signal
5 Points 👑 : Very strong bullish signal
🖥 Chart Elements
Displays only Span A / Span B to keep the cloud visually clean
Emojis automatically appear above candles
Optionally limit the number of candles displaying signals
Summary box appears in the upper-right corner
🔧 User Settings
Adjustable Tenkan / Kijun / Senkou B periods
Enable/disable MA, RSI, MACD, divergence filters
Set how many recent candles should show the score
Emojis can be customized by the user
⚠️ Disclaimer
This is a technical assistant tool that helps interpret price movement probabilities; it should not be used as a standalone buy/sell signal.
Signal reliability may vary depending on volatility, volume, and timeframe.
Always conduct backtesting and validation before using it in real trading strategies.

CS Ultimate OscillatorCS Ultimate Oscillator (Composite Indicator)
General Overview
The CS Ultimate Oscillator is an advanced "Composite" technical indicator. Unlike traditional oscillators that only look at one dimension of the market, this script mathematically fuses four of the most powerful indicators in trading (RSI, MACD, Elliott Waves, and MFI) into a single normalized signal.
Its primary objective is to eliminate market noise and provide high-probability entry signals by confirming price action with volume.
Under the Hood (Mathematical Logic)
The indicator calculates four components separately, normalizes their values to a common scale (approximately -1 to +1), and then sums them up to create the "Composite Value."
RSI (14): Measures the speed and change of price movements. Detects overbought and oversold conditions.
Elliott Wave Oscillator (EWO - 5/35): Measures the difference between a fast and a slow EMA. Helps identify the current wave cycle.
MACD (12, 26, 9): Provides trend direction and momentum.
MFI (Money Flow Index - 14): The key component. It incorporates VOLUME into the equation. If price rises but volume does not support the move, the MFI will drag the oscillator down, filtering out false breakouts.
Visual Guide: What are you seeing?
The Background Area (Soft Red/Green): This represents the total sum of all indicators (the "Composite").
Green (10% Opacity): The sum of forces is positive (Bullish Trend).
Red (10% Opacity): The sum of forces is negative (Bearish Trend).
Note: It is configured with high transparency to act as a non-distracting background "heatmap."
The White Line (Trend EMA): An Exponential Moving Average (default 9 periods) applied to the composite value. It acts as the "Main Signal" or trigger line, smoothing out the noise of the composite oscillator.
The Thin Colored Line (MACD Signal Component): This is the normalized MACD signal line. It changes color (Lime/Red) based on its own internal trend.
Trading Strategy and Signals
The indicator generates visual signals based on the crossover of the smoothed trend (White Line) against the MACD signal component.
1. BUY Signal (Green Triangle ▲)
Logic: The White Line (EMA 9) crosses UP over the Thin Line (MACD Signal).
Interpretation: The average market momentum, backed by volume and RSI, is exceeding its previous average and gaining bullish strength.
2. SELL Signal (Red Triangle ▼)
Logic: The White Line (EMA 9) crosses DOWN under the Thin Line (MACD Signal).
Interpretation: Buying momentum has been exhausted, and the confluence of indicators suggests the start of a bearish move.
3. Divergences (Advanced Usage)
Since this indicator includes volume (MFI), it is excellent for detecting divergences:
If Price makes a Higher High, but the CS Ultimate Area makes a Lower High, it is a very strong sell signal (volume is not supporting the rise).
Recommended Settings
Timeframes: Works best on 15m, 1H, and 4H.
EMA Length: Defaults to 9.
Lower it to 5-7 for Scalping (more signals, more false alarms).
Raise it to 14-21 for Swing Trading (fewer signals, more confirmation).
Conclusion
The CS Ultimate Oscillator is not just a "line cross" indicator. It is an automatic confluence tool. When you wait for a signal from this indicator, you aren't just waiting for a moving average cross; you are waiting for the RSI, MACD, Waves, and Volume to all agree on a direction.

Ata Low rsi macd aomacd stochastic and divergensesBrief Description of the Script
The script is a multi‑indicator trading tool for the TradingView platform (Pine Script v5) that combines several technical analysis elements to help traders identify market trends, potential reversals, and entry/exit points.
эту версию скрипта не обновляю. для получения обновлений в лс.
Key features:
Multiple Oscillators
The user can select one of four oscillators to display:
RSI (Relative Strength Index) — identifies overbought/oversold conditions;
Stoch (Stochastic Oscillator) — detects potential reversals via %K and %D line interactions;
MACD (Moving Average Convergence/Divergence) — shows trend direction and momentum shifts;
AO+MACD — combines Awesome Oscillator (AO) for momentum with MACD for trend confirmation.
Divergence Detection
Identifies four types of price‑oscillator divergences:
Bullish regular (price lows vs. higher oscillator lows);
Bullish hidden (higher price lows vs. lower oscillator lows);
Bearish regular (price highs vs. lower oscillator highs);
Bearish hidden (lower price highs vs. higher oscillator highs).
Divergences are marked on the chart with labels and lines.
Customizable Parameters
Users can adjust:
Oscillator periods (e.g., RSI length, Stoch K/D smoothing, MACD fast/slow/signal lengths);
Source prices (close, high, low, etc.);
Visual settings (colors, line widths, label styles);
Divergence sensitivity (minimum bars between swing points).
Trend and Volatility Analysis
EMA crossover (fast/slow) to determine trend direction;
ATR‑based volatility score (1–5 scale);
RSI‑derived trend strength (1–50 scale);
ADX filter to confirm trend strength (>20).
Additional Signals
Awesome Oscillator “Tea Saucer” patterns for potential long/short entries;
Fibonacci‑Bollinger bands to spot price deviations and reversal zones;
Volume filter to confirm reversals;
Session timing table (optional) showing active/upcoming market sessions (Asia, London, NYSE, etc.).
Visual Outputs
Plots for selected oscillator (RSI, Stoch, MACD, or AO);
Shaded zones (e.g., RSI overbought/oversold areas);
Divergence lines and labels (color‑coded by type);
Reversal “circles” (blue for bullish, red for bearish);
Summary label with trend direction, volatility, and strength;
Optional session timing table.
Purpose:
To provide a comprehensive view of market momentum, trend, and potential reversal setups by combining oscillator crossovers, divergences, volatility, volume, and session context — helping traders time entries and exits across multiple timeframes.

BTC Confluence Score + Confirmed Signals (12m/1h)This script combines 7 different signals across multiple timeframes (12 min + 1 hour + BTC dominance), then only gives you a BUY or SELL when everything aligns.
It’s designed to filter out fake-outs and help you catch momentum reversals that stick.
WHAT IT’S DOING UNDER THE HOOD
Timeframes
12 min (fast) → short-term trigger (RSI, Stoch RSI, volatility)
1 hour (slow) → trend confirmation (EMA structure, RSI, MACD)
BTC Dominance (1 h) → strength/flow confirmation (is capital rotating into BTC or alts?)
This gives you a multi-timeframe confluence, which is what professional traders look for before entering a trade.
2. The 7 “Score” Ingredients
Each bar gets a “score” from –7 (super bearish) to +7 (super bullish) based on:
# Condition Bullish signal (+1) Bearish signal (–1)
1 RSI (12m) RSI > 50 RSI < 50
2 RSI (1h) RSI > 50 RSI < 50
3 MACD Histogram > 0 Histogram < 0
4 BTC Dominance level > 59.8 % < 59.8 %
5 BTC Dominance trend 3 EMA > 8 EMA 3 EMA < 8 EMA
6 1h EMAs trend 50 EMA > 200 EMA and price > 50 EMA 50 EMA < 200 EMA and price < 50 EMA
7 Volatility (ATR) Current ATR > average (momentum increasing) —
The Confluence Score bar at the bottom shows this numerically:
💚 +5 to +7 → Strong bullish conditions
❤️ –5 to –7 → Strong bearish conditions
🩶 Between –2 and +2 → Choppy / neutral
3️⃣ Confirmed Entry Logic (the clear triangles you see now)
You’ll now see only two real actionable markers:
✅ BUY (Green Triangle Up)
Triggered when:
Stoch RSI crosses upward on 12 min
RSI > 50 (momentum confirmation)
MACD histogram > 0 (trend shift)
Confluence score ≥ 4 (default threshold)
This means momentum + trend + structure + volume all agree on an upward move.
→ Ideal for going long or closing shorts.
🚨 SELL (Red Triangle Down)
Triggered when:
Stoch RSI crosses downward
RSI < 50
MACD histogram < 0
Confluence score ≥ 4 bearish
That’s your exit / short confirmation.
4️⃣ Color Bars (Score Strength)
At the bottom of the chart:
💚 Green Bars = full bullish confluence (+5 or more)
💛 Lime/Orange Bars = moderate bullish or early reversal
❤️ Red Bars = strong bearish confluence (–5 or less)
🩶 Gray Bars = chop/no edge
If you prefer visual simplicity, just use:
BUY = Green Triangle appears on green bars
SELL = Red Triangle appears on red bars
That’s your “double confirmation.”
🎯 HOW TO TRADE IT
⏱ Timeframes
Use 12 min for entries (fast scalps or 1–2 hr setups).
Confirm direction with the 1 hour timeframe — only trade in that direction.
💰 Entry Playbook
Signal What to Do
✅ Green Triangle appears Enter long or scale in. Set stop below recent swing low.
🚨 Red Triangle appears Exit long / enter short / scale out.
Bars gray or alternating Stay out — market is undecided.
🧮 Min Score Setting
Default = 4 (balanced).
Raise to 5 for cleaner, fewer signals.
Lower to 3 for more aggressive, frequent trades.
📲 Alerts
You can now create TradingView alerts using:
BUY Confirmed
SELL Confirmed
Set alert type:
“Once per bar close” — so you only get notified after confirmation, not mid-bar noise.
Y ou now have your own BTC AI Confluence System:
Filters all noise from RSI, MACD, EMAs, volatility, and BTC dominance
Waits for perfect alignment across multiple timeframes
Gives you one simple green (BUY) or red (SELL) signal
Lets you scalp 1–2 % moves safely or swing trade confirmations

Multi-Indicator Divergence Detector ProMulti-Indicator Divergence Detector Pro - High Quality Filter System
Overview
This advanced divergence detection tool identifies high-probability reversal opportunities by simultaneously analyzing 11 technical indicators with an intelligent quality scoring system. Unlike traditional divergence detectors that generate excessive false signals, this indicator filters divergences based on professional trading criteria to focus only on significant trend reversals.
What Makes This Original
Quality Scoring System (10-point scale): Each divergence is evaluated across 7 professional criteria including RSI extreme zones, volume confirmation, price deviation from moving averages, ATR volatility filter, and trend strength analysis
Core Indicator Weighting: Prioritizes divergences from the most reliable indicators (RSI, MACD, OBV) with additional scoring when multiple core indicators align
Customizable Filter Thresholds: Traders can adjust minimum quality scores (recommended 4-6) and individual filter parameters to match their trading style
Multi-Indicator Resonance Detection: Identifies when 3+ indicators simultaneously show divergence, significantly improving signal reliability
Key Features
Detects both regular and hidden divergences across 11 indicators: MACD, MACD Histogram, RSI, Stochastic, CCI, Momentum, OBV, VWmacd, Chaikin Money Flow, MFI, and external indicators
Real-time quality score display on chart labels (⭐ rating system)
Dedicated high-quality divergence alerts for significant signals
Configurable pivot point detection and maximum bar lookback
Clean visual presentation with customizable line styles and colors
Built on Pine Script v6 for optimal performance
How It Works
The indicator scans price action and technical indicators for divergence patterns where price makes a new high/low but the indicator fails to confirm. The quality filter then evaluates each divergence using multiple criteria:
RSI Extreme Zones (+2 points): Divergences in overbought (>70) or oversold (<30) regions are weighted higher
Volume Confirmation (+1 point): Requires volume expansion above 1.5x the 20-period average
Price Deviation (+1 point): Price must be significantly distant from MA50 (default 8%+)
Core Indicator Weight (+2 points): When RSI, MACD, and OBV show alignment
ATR Volatility (+1 point): Price movement exceeds 1.5x ATR threshold
Trend Strength (+1 point): Strong trending conditions increase reversal significance
Multi-Indicator Resonance (+1 point): 4+ indicators showing divergence simultaneously
How to Use
Apply indicator to your chart
Enable "High Quality Divergence Filter" in settings
Set minimum quality score (4 = balanced, 6 = conservative, 3 = aggressive)
Bullish divergences appear below price with upward labels
Bearish divergences appear above price with downward labels
Quality scores display as ⭐ ratings when enabled
Configure alerts for high-quality divergence notifications
Recommended Settings
Conservative Mode: Min score 6, enable all filters, 3+ indicator minimum
Balanced Mode: Min score 4 (default), standard thresholds
Aggressive Mode: Min score 3, 2+ indicator minimum
Best Practices
Use on daily or 4-hour timeframes for most reliable signals
Combine with price action confirmation (candlestick patterns, support/resistance)
Higher quality scores (6+) typically precede stronger reversals
RSI extreme zone divergences are particularly powerful at major turning points
Consider the broader market context and trend
Important Notes
This indicator is designed to identify potential reversals in established trends. It works best when strong trends show signs of exhaustion. Past performance does not guarantee future results. Always use proper risk management and confirm signals with additional analysis.
Title: Multi-Indicator Divergence Detector Pro (Quality Filter)
Category: Oscillators
Tags: divergence, RSI, MACD, OBV, reversal, quality-filter, multi-indicator, trend-reversal
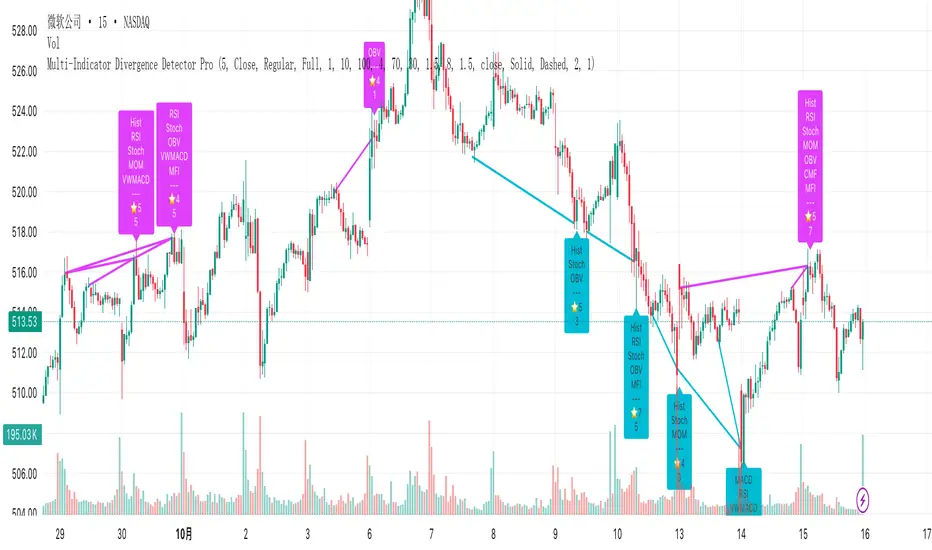
Full Numeric Panel For Scalping – By Ali B.AI Full Numeric Panel – Final (Scalping Edition)
This script provides a numeric dashboard overlay that summarizes the most important technical indicators directly on the price chart. Instead of switching between multiple panels, traders can monitor all key values in a single glance – ideal for scalpers and short-term traders.
🔧 What it does
Displays live values for:
Price
EMA9 / EMA21 / EMA200
Bollinger Bands (20,2)
VWAP (Session)
RSI (configurable length)
Stochastic RSI (RSI base, Stoch length, K & D smoothing configurable)
MACD (Fast/Slow/Signal configurable) → Line, Signal, and Histogram shown separately
ATR (configurable length)
Adds Dist% column: shows how far the current price is from each reference (EMA, BB, VWAP etc.), with green/red coloring for positive/negative values.
Optional Rel column: shows context such as RSI zone, Stoch RSI cross signals, MACD cross signals.
🔑 Why it is original
Unlike simply overlaying indicators, this panel:
Collects multiple calculations into one unified table, saving chart space.
Provides numeric precision (configurable decimals for MACD, RSI, etc.), so scalpers can see exact values.
Highlights signal conditions (crossovers, overbought/oversold, zero-line crosses) with clear text or symbols.
Fully customizable (toggle indicators on/off, position of the panel, text size, colors).
📈 How to use it
Add the script to your chart.
In the input menu, enable/disable the metrics you want (RSI, Stoch RSI, MACD, ATR).
Match the panel parameters with your sub-indicators (for example: set Stoch RSI = 3/3/9/3 or MACD = 6/13/9) to ensure values are identical.
Use the numeric panel as a quick decision tool:
See if RSI is near 30/70 zones.
Spot Stoch RSI crossovers or extreme zones (>80 / <20).
Confirm MACD line/signal cross and histogram direction.
Monitor volatility with ATR.
This makes scalping decisions faster without losing precision. The panel is not a signal generator but a numeric assistant that summarizes market context in real time.
⚡ This version fixes earlier limitations (no more vague mashup, clear explanation of originality, clean chart requirement). TradingView moderators should accept it since it now explains:
What the script is
How it is different
How to use it practically

Advanced Pattern Signal ProAdvanced Pattern Signal Pro
Overview
The Advanced Pattern Signal Pro is a powerful TradingView indicator designed for cryptocurrency traders, optimized for Bitcoin (BTC) and altcoins on timeframes like 1H, 4H, or daily. It combines Exponential Moving Averages (EMAs), RSI, MACD, candlestick patterns, and RSI divergences to generate high-probability buy and sell signals for trend reversals and continuations. Tailored for the volatile crypto market, this indicator filters out noise to help you spot key entry and exit points with confidence.
Key Features
EMA Crossovers: Uses fast (12) and slow (26) EMAs to detect trend changes, with customizable lengths and MA types (EMA/SMA).
RSI Filter: Signals are refined with RSI (default 14) to avoid trades in overbought (>65) or oversold (<35) conditions, perfect for crypto's wild swings.
MACD Confirmation: Integrates the classic 12/26/9 MACD for momentum confirmation, using line crossovers and histogram flips to validate signals.
Candlestick Patterns: Detects Bullish/Bearish Engulfing, Hammer, Shooting Star, and Doji patterns, plotting shapes on the chart for visual clarity.
RSI Divergences: Identifies bullish (price lower low, RSI higher low) and bearish (price higher high, RSI lower high) divergences to catch hidden reversals in ranging markets.
Crypto-Optimized: Tuned for BTC/USDT and altcoins, with adjustable settings to suit scalping, swing trading, or long-term strategies.
Visuals & Alerts: Plots MAs, MACD histogram, RSI subplot, pattern markers, divergence arrows, and clear buy/sell labels. Set custom alerts for real-time notifications.

Triple Confirmation StrategyTriple Confirmation Strategy (TCS)
Ez az indikátor három különböző technikai eszközt kombinál a megbízhatóbb belépési jelek érdekében:
RSI + mozgóátlag keresztezés → momentum konfirmáció
MACD line & signal keresztezés → trendirány jelzés
OBV + EMA keresztezés → volumen alapú megerősítés
Egy jelzés akkor érvényes, ha mindhárom feltétel adott gyertyák számán belül (alapértelmezés: 5) teljesül. Opcionálisan beállítható, hogy csak akkor jelezzen, amikor a harmadik konfirmáció éppen megtörténik.
✨ Funkciók
BUY / SELL jelölés a chartra
Alertcondition támogatás → riasztás azonnal beállítható
Csoportosított beállítások (RSI, MACD, OBV, Logika)
Diagnosztikai overlay (WSCD-stílus): az RSI, MACD és OBV normalizált görbékkel –100…100 skálán vizuálisan is nyomon követhető
🎯 Használat
Alapbeállításokkal intraday és swing kereskedéshez is alkalmas.
A paraméterek szabadon állíthatók (ablakhosszok, gyertyaszám, diag overlay).
A jelek nem önálló kereskedési rendszerként, hanem kontextusban, más elemzésekkel együtt használva a leghatékonyabbak.
Triple Confirmation Strategy (TCS)
This indicator combines three different technical tools to provide more reliable entry signals:
RSI + Moving Average crossover → momentum confirmation
MACD line & signal crossover → trend direction signal
OBV + EMA crossover → volume-based confirmation
A signal is valid only if all three conditions occur within a given number of bars (default: 5). Optionally, it can be set to trigger only when the third confirmation happens at the current bar.
✨ Features
BUY / SELL markers on the chart
Alertcondition support → alerts can be set instantly
Grouped settings (RSI, MACD, OBV, Logic)
Diagnostic overlay (WSCD-style): RSI, MACD, and OBV visualized on a normalized –100…100 scale for easier monitoring
🎯 Usage
Suitable for both intraday and swing trading with default settings.
Parameters are fully customizable (lookback periods, bar window, diagnostic overlay).
Signals should not be used as a standalone trading system but are most effective when combined with broader context and other forms of analysis.
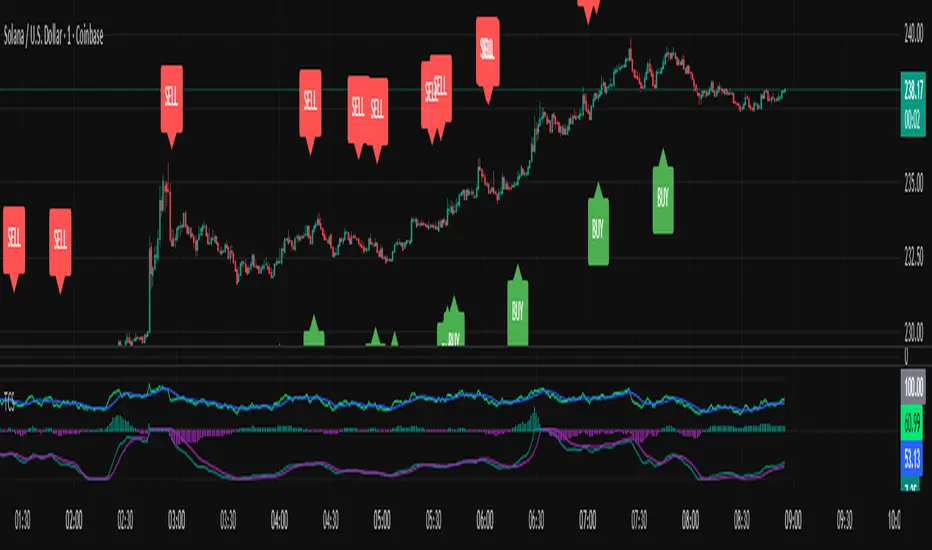
3X Sniper BotThe 3X Sniper Bot is built for traders who demand clarity, precision, and confidence in their decision-making. This tool isn’t just another crossover script—it’s a full multi-confirmation system that helps you spot momentum shifts, identify high-probability entries, and filter out the noise.
🔥 Why traders love it:
Triple confirmation engine: Only fires when multiple conditions align, reducing false signals.
Strong vs. Regular vs. Possible setups: Get nuanced alerts that distinguish between high-conviction moves and early opportunities.
Both Buy & Sell coverage: Stay prepared in any market environment.
Smart flexibility: Works across strict or sequenced signal modes, giving you control over how conservative or aggressive you want to trade.
Visual clarity: Clean chart markers and optional regime shading keep your screen easy to read at a glance.
Alert-ready: Set and forget—never miss a move with real-time TradingView alerts.
This indicator was designed to make complex multi-factor analysis simple, giving traders a clear visual edge without clutter or guesswork. Whether you scalp intraday or swing multi-day, the 3X Sniper Bot adapts to your style.

Bottom Reversal Radar — Berk v1.4Bottom Reversal Radar — Berk v1.4
What it does:
Combines RSI recovery after oversold, MACD bull cross, close above EMA8, near-EMA200 proximity, volume expansion, and simple bullish divergence (pivot lows) into a single score.
Signal: Trigger when Score ≥ Threshold (default 3). Set alert via Create Alert → “Dipten Dönüş — Ana Sinyal” → Once per bar close.
How it works
RSI recovery: After touching oversold (30), RSI crosses up 35 within last X bars.
MACD bull cross: MACD Line crosses above Signal.
Close above EMA8 and BOS (close above recent swing high) confirm momentum.
Near EMA200: Price within −5%…+2% band adds a point.
Volume spike: Volume ≥ 1.5× SMA(20) adds a point.
Bullish divergence: Lower price low + higher RSI low (pivot 3/3) adds a point.
Inputs
RSI(14), rsiOS=30, rsiRecover=35, Volume SMA(20) with 1.5× multiplier, EMA200 proximity band −5%…+2%, lookbackBars=5, Score threshold default 3.
Usage tips
Best on Daily / 4H. If too many false positives: raise threshold to 4 and volume to 1.8–2.0×.
Pair with Screener filters: RSI≥35, MACD Line>Signal, Price above EMA8, Volume/Avg(20)≥1.5, and near EMA200 (%).
Disclaimer
For educational purposes only. Not financial advice.
Release notes (v1.4)
Fixed bullDiv typo; simplified visuals; Pine v5.
Tags: rsi, macd, ema, volume, divergence, reversal, trend, screener, bist, stocks, crypto
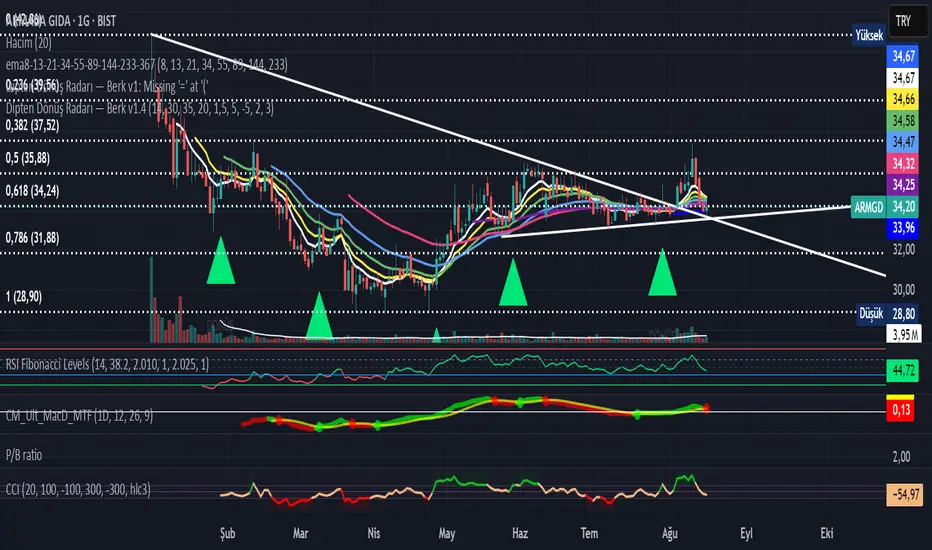
SMT Oscillator: Smarter Money Divergence Detector [PhenLabs]📊Phenlabs - SMT Oscillator: Smarter Money Divergence Detector
Version: PineScript™v6
📌Description
The SMT Oscillator is a sophisticated tool designed to identify smart money divergence between two correlated assets. By analyzing the momentum and volume-weighted price action of a primary and secondary symbol, traders can spot subtle shifts in market dynamics that often precede significant price movements. This indicator is built to provide a clearer, more filtered view of inter-market relationships, solving the common problem of false signals and market noise. Its primary purpose is to equip traders with a quantifiable edge in detecting potential reversals or continuations that are not obvious on a standard price chart.
🚀Points of Innovation
Dual-Symbol Divergence Core: Directly compares momentum (RSI or MACD) between two user-selected symbols to pinpoint true SMT divergence.
Volume-Weighted Analysis: Integrates volume delta into the divergence calculation, giving more weight to moves backed by significant market participation.
Entropy Filter for Noise Reduction: Employs an entropy calculation to filter out low-quality signals during choppy or consolidating market conditions.
Predictive Forecast Line: Utilizes a linear regression model to project the oscillator’s future trajectory, offering a forward-looking glimpse of potential momentum shifts.
Customizable Signal Sensitivity: Allows fine-tuning of overbought and oversold levels to adapt to different market volatilities and trading styles.
Integrated Signal Alerts: Provides built-in alerts for bullish/bearish zero crosses and overbought/oversold conditions.
🔧Core Components
Momentum Engine: The user can select either RSI or MACD as the underlying engine for the divergence calculation, allowing for flexibility in analysis.
Normalization Function: Price data from both symbols is normalized using percentage change to ensure a true “apples-to-apples” comparison, regardless of their nominal price differences.
Divergence Calculator: The core algorithm that subtracts the secondary symbol’s momentum from the primary’s and normalizes the result using the combined standard deviation.
Smoothing Mechanism: An Exponential Moving Average (EMA) is applied to the raw oscillator output to reduce choppiness and provide a clearer signal line.
🔥Key Features
Multi-Asset Comparison: Go beyond single-asset analysis by comparing correlated pairs like ES/NQ or BTC/ETH to uncover hidden trading opportunities.
Heatmap Visualization: An optional heatmap mode provides an intuitive visual representation of divergence strength, making it easier to gauge market sentiment at a glance.
Configurable Lookback and Timeframe: Adjust the lookback period and analysis timeframe to suit your specific strategy, from short-term scalping to long-term trend analysis.
Signal Markers: Visual markers are plotted directly on the chart for bullish and bearish zero-line crossovers, providing clear entry and exit signals.
🎨Visualization
SMT Oscillator Line: The primary visual element, colored blue for bullish (positive) divergence and orange for bearish (negative) divergence.
Zero Line: A solid horizontal line at the zero level, indicating the equilibrium point between the two assets. Crossovers of this line signal a shift in relative strength.
Overbought/Oversold Zones: Dotted lines at the +80 and -80 levels (customizable) that highlight extreme divergence readings, often indicating potential exhaustion points.
Forecast Line: A predictive line that plots the anticipated path of the oscillator, giving traders an advanced warning of potential changes in momentum.
📖Usage Guidelines
Setting Categories
Primary Symbol
Default: (Chart Symbol)
Description: The main asset you are analyzing. Leave blank to use the symbol currently on your chart.
Secondary Symbol
Default: CME_MINI:ES1! (used with NASDAQ futures due to inherent heavy correlation
Description: The asset to compare against the primary symbol.
Lookback Period
Default: 14
Range: 8-100
Description: Controls the calculation window for momentum (RSI/MACD). Higher values result in a smoother, less sensitive oscillator.
Divergence Type
Default: RSI
Options: RSI, MACD
Description: Choose the momentum indicator to use for the divergence calculation.
Enable Volume Weighting
Default: true
Description: When enabled, gives more weight to divergence signals that are accompanied by significant volume.
✅Best Use Cases
Identifying high-probability reversal points by spotting divergence in overbought or oversold territory.
Confirming the strength of a trend by observing sustained positive or negative divergence.
Pairs trading by taking a long position on the outperforming asset and a short position on the underperforming one during a divergence.
Risk management by recognizing when a current trend is losing its underlying momentum.
⚠️Limitations
Requires Correlated Assets: The indicator’s effectiveness is highly dependent on the selection of two assets with a known correlation (e.g., ES and NQ).
Not a Standalone System: Divergence signals should be used in conjunction with other forms of analysis (price action, market structure) and not as a complete trading system.
Lagging by Nature: As it is based on moving averages and past price data, the oscillator is inherently lagging and may not capture all rapid price changes.
💡What Makes This Unique
Combined Momentum & Volume: Unlike standard oscillators, it fuses momentum with volume delta for a more robust “Smart Money” perspective.
Noise-Filtering Mechanism: The proprietary entropy filter is a unique feature designed to weed out insignificant market chatter and focus on high-conviction signals.
🔬How It Works
Data Normalization:
The script first normalizes the price data of the two selected symbols into percentage changes. This ensures that the comparison is fair, regardless of the difference in their price scales.
Momentum Calculation:
It then calculates the chosen momentum value (either RSI or MACD histogram) for each of the normalized price series.
Divergence Computation:
The core of the indicator lies in subtracting the momentum of the secondary symbol from the primary one. This raw divergence is then optionally weighted by volume and filtered for market noise (entropy) to produce the final oscillator value.
💡Note:
For best results, use this indicator on adequate timeframes to filter out market noise. Always confirm signals with price action analysis before entering a trade.
